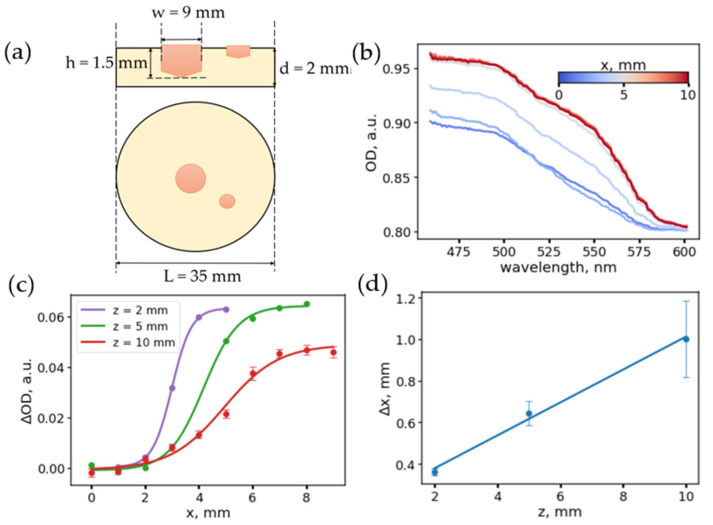
Figure 2.
(a) Scheme of a heterogeneous phantom simulating a tumor. (b) Examples of the optical density spectra measured in different points of the phantom with fiber to tissue distance z = 2 mm. Variations in the spectrum band shape and the transition region are visible. (c) Dependence of the difference in absorption at wavelengths of 500 and 600 nm for different distances between the fiber tip and the phantom surface. (d) Dependence of the width of the transition zone on the distance between the surface and the fiber tip.

