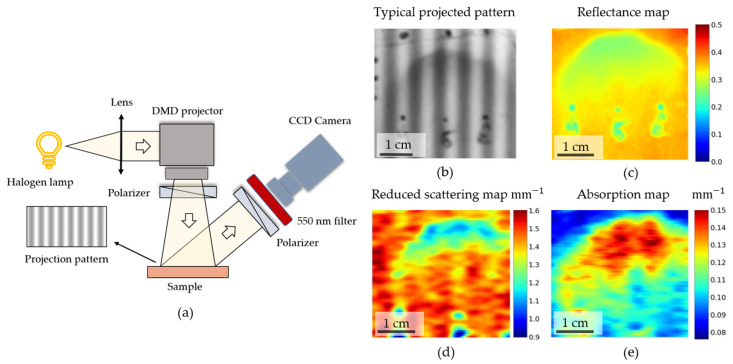
Figure 4.
(a) Scheme of the experimental setup used to perform spatial frequency domain imaging. (b) An example of a raw intensity map obtained with structured illumination (spatial frequency f = 0.15 mm−1). (c) An example of a reflectance coefficient obtained after imaging (f = 0 mm−1). (d,e) Maps of reduced scattering (d) and absorption (e) coefficients obtained for inhomogeneous optical phantom using fitting of diffuse reflectance coefficients on frequency, as described in Section 2.5.

