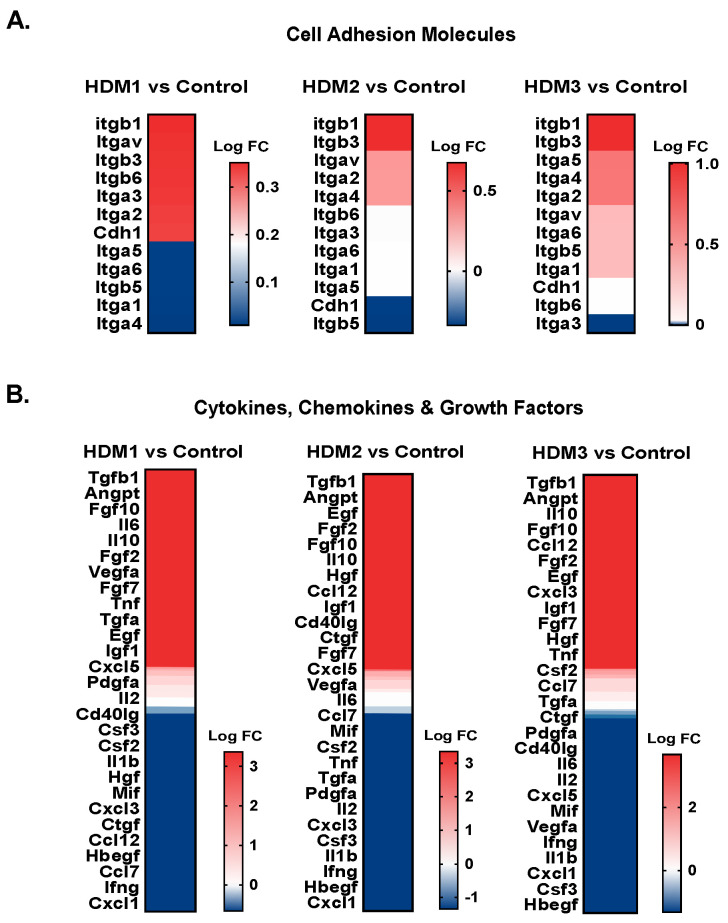
Figure 5.
Targeted transcriptomic profiles of cell adhesion molecules and different soluble mediators in wound treated with different acellular dermal matrices (ADMs). Summary of gene expression analyses of (A) cell adhesion molecules, and (B) cytokines, chemokines, and growth factors in wounds treated with ADM1, ADM2, and ADM3. The data are presented as log2FC (n = 3). For each presented heat map, a separate color scale legend with values can be found on the right side.

