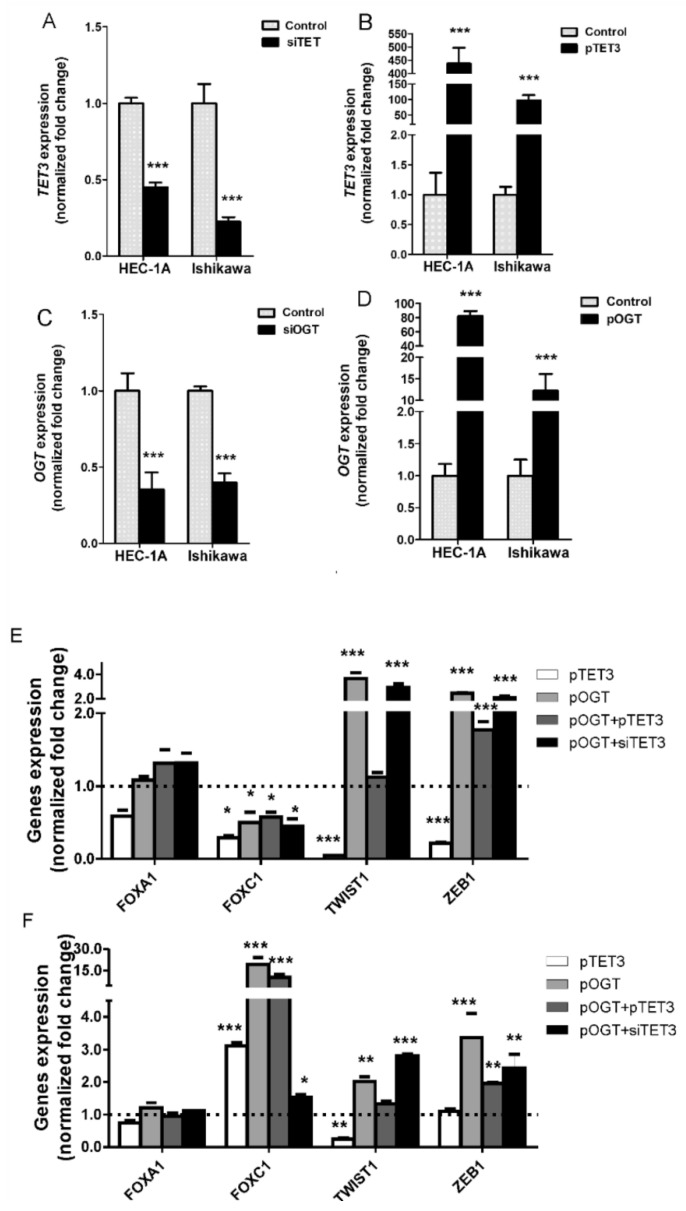
Figure 1.
Gene expressions in cells with TET3 and OGT dysregulation. In HEC-1A and Ishikawa cells, TET3 (A) and OGT (C) expression were decreased by transfection of cells with specific siRNA or increased via transfection with plasmid DNA (B,D) respectively). The mRNA levels were analyzed by real-time PCR methods (for details see Methods). The mRNA expression of FOXA1, FOXC1, TWIST1, and ZEB1 were evaluated in HEC-1A (E) and Ishikawa (F) cells with increased expression of TET3 (pTET3), OGT (pOGT), co-expression of OGT and TET3 (pOGT + pTET3), and increased expression of OGT and reduced expression of TET3 (pOGT + siTET3). The expressions of genes in each kind of sample were compared to appropriate controls, i.e., cells treated with empty vectors or nonsilent siRNA duplexes in which expression was assumed to be 1. Data show mean ± SE (n = 5), * p < 0.01, ** p < 0.001, *** p < 0.0001.

