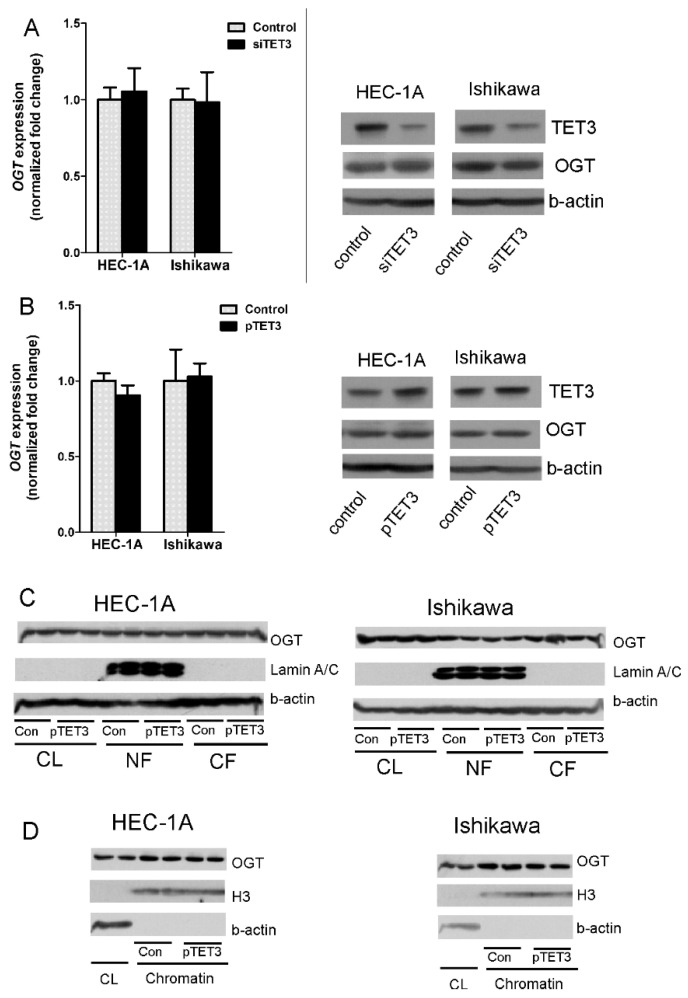
Figure 2.
OGT expression and localization in cells with TET3 deregulation. OGT expression was analyzed at mRNA and protein levels in HEC-1A and Ishikawa cells with TET3 reduced (A) or increased (B) expression using the real-time PCR method or Western blot method. (C,D) are the results of OGT identification by Western blot method in cellular fractions in control cells and cells with TET3 overexpression. CL—whole cell lysate; NF—nuclear fraction; CF—cytoplasmic fraction.

