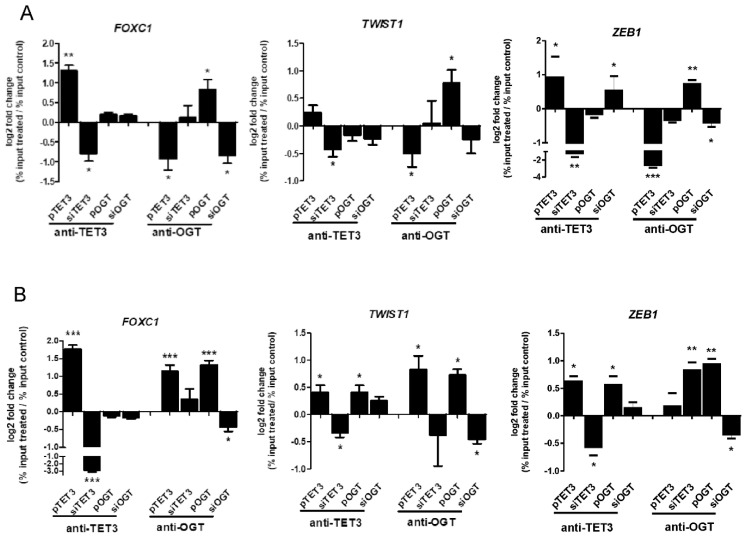
Figure 3.
OGT and TET3 binding to chromatin in FOXC1, TWIST1, and ZEB1 regions. Chromatin immunoprecipitation (ChIP) analysis was performed for HEC-1A (A) and Ishikawa (B) endometrial cancer cells treated with plasmid DNA or siRNA with specific antibodies. Differential chromatin enrichment was quantified using real-time quantitative PCR. The results were calculated as % input (% input = % input of specific antibodies probes—% input mock IgG) and are presented as a log2fold change (Fold change = % input of treated cells sample/% input of control cells sample). Data show mean ± SE, (n = 4) * p < 0.01, ** p < 0.001, *** p < 0.0001.

