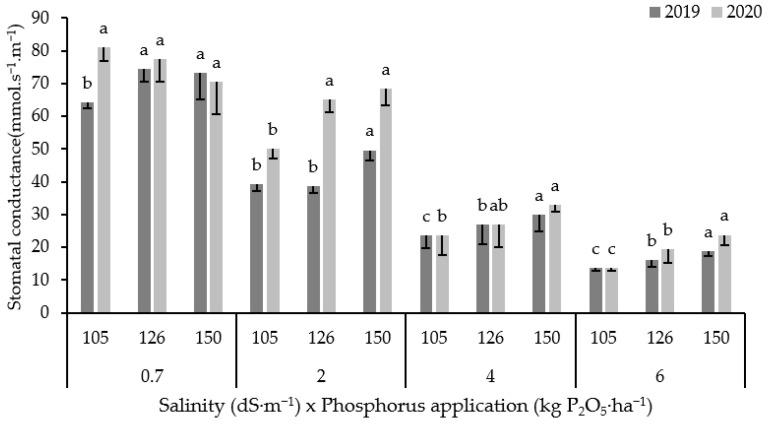
Figure 1.
Variation in stomatal conductance for 2019 and 2020 seasons under different salinity levels and P rates. Error bars indicate the standard deviation. Phosphorus treatments under the same salinity level and for the same season without a common letter are significantly different at p < 0.05. Small letters (a, b and c) indicate the statistically homogenous groups.

