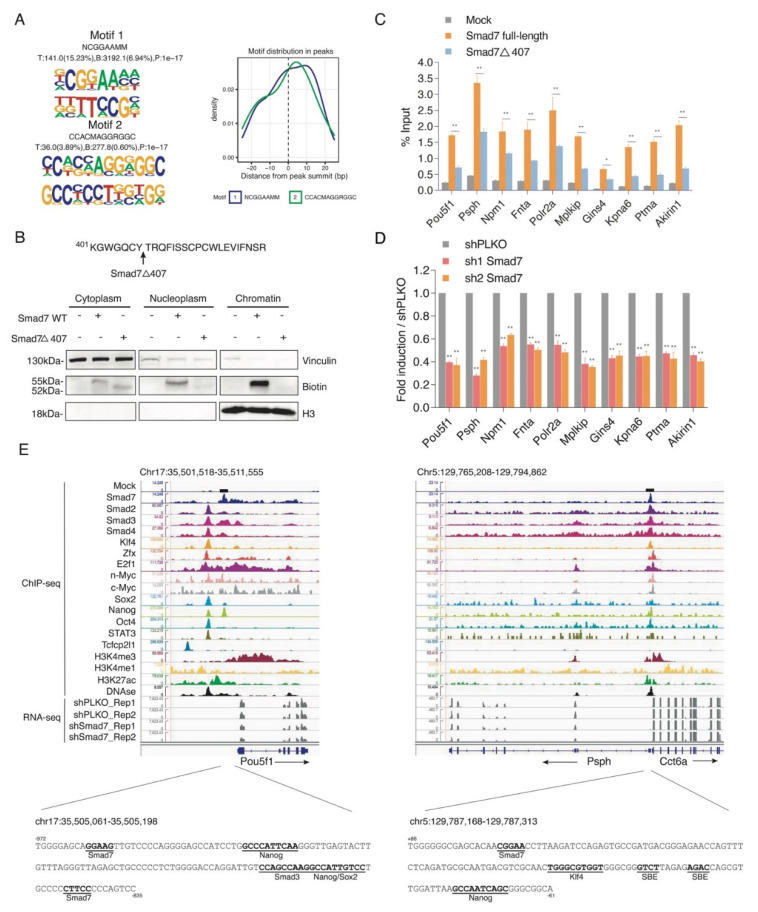
Figure 3.
Smad7 binds to the promoters of genes involved in ESC self-renewal. (A) Left panel: De novo DNA sequence motifs and their STAMP logos and enrichment statistics, including observed binding sites. Occupancy signals within ±25 bp of the Smad7 peak summit are shown. (B) Top panel: Schematic of the mutant of Smad7 (Smad7Δ407), which lacks the last 19 amino acids at the C terminal. Smad7Δ407 construct also has an Avi-tag at its N terminal. Bottom panel: Western blot showing the subcellular fractionation of Smad7 WT and Smad7Δ407. Biotin antibody was used to compare the expression of exogenous (bio-tagged) Smad7 WT and Smad7Δ407 in three fractions of cells. BirA cells, Smad7 WT, and Smad7Δ407 transfected cells were used in this experiment. Vinculin was used as a cytoplasm marker, and H3 was used as a chromatin marker. (C) RT-qPCR analysis of BioSmad7 WT and Smad7Δ407 ChIP samples at the promoters of the indicated genes. The results are shown as the percentage (1/100) of the input. Data are shown as mean ± SEM; n = 3. ** p < 0.01. * p < 0.05. (D) RT-qPCR analysis of the indicated transcripts upon a knockdown (KD) of Smad7 proteins. The results are shown as fold difference normalized to shPLKO. Data are shown as mean ± SEM; n = 3. ** p < 0.01. (E) Representative genomic occupancy profiles of genes identified by BioSmad7 ChIP-Seq. IGV images showing the comparison of ChIP-seq peaks of Smad7 binding (current study), other 14 factors (accession code GSE11431, GSE125116), the locations of histone H3 modifications (accession code GSE12241, GSE11172, and GSE31039), DNAse, and RNA-seq of two independent experiments of Smad7 knockdown (current study) at genes downregulated by Smad7 knockdown. Two examples (Pou5f1 and Psph) are shown. The genes and their direction of transcription are indicated by arrows. The binding loci of Smad7 are indicated by black boxes. Putative transcription factor binding sites are annotated in bold black.

