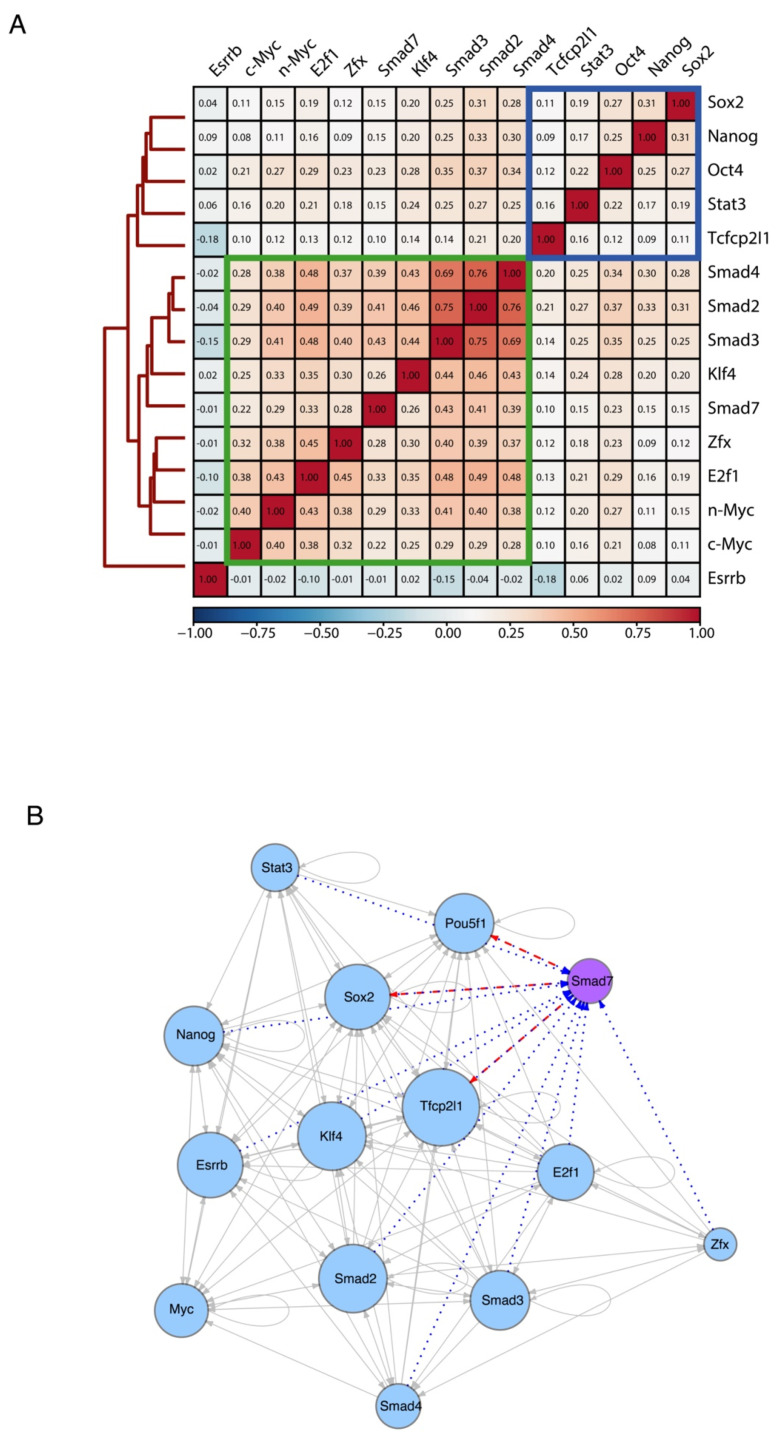
Figure 4.
Smad7 participates in ES-Cell Regulatory Network. (A) Heatmap showing the similarity of their binding sites among diverse transcription factors and coregulators (accession code GSE11431, GSE125116) as well as Smad7 (current study) in mouse ESCs. Colors in the heatmap show the level of overlap for each pair of samples (red, all binding sites overlapped; orange, overlap expected by chance; blue, mutually exclusive binding). Core transcription factors are boxed in blue. Myc cluster is boxed in green. (B) Transcriptional network of regulatory interactions predicted from ChIP-seq binding assays. Nodes are ChIP-seq-assayed transcription factors (Smad7 (purple node) is from the current study, other factors (blue nodes) are from published datasets: accession code GSE11431, GSE125116). The size of each circle represents the degree of the interaction among different factors. Arrowhead indicates the direction of transcriptional regulation. The transcriptional regulation by Smad7 is highlighted by two different patterns: the red dash line indicates the regulation starting from Smad7 (i.e., Pou5f1, Sox2, and Tfcp2l1), and the blue dot line represents the regulation towards Smad7 (i.e., Pou5f1, Sox2, Tfcp2l1, Stat3, Nanog, Esrrb, Klf4, Smad2, Smad3, Smad4, E2f1, and Zfx).

