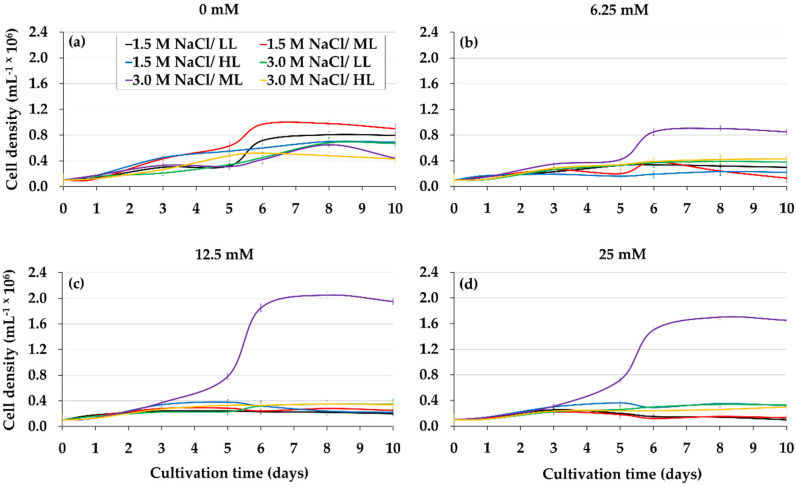
Figure 2.
Cell density of D. salina cultured with different combinations of glycerol, salinity, and light intensity. The following interaction is indicated: glycerol, 0 mM (a), 6.25 mM (b), 12.5 mM (c) and 25 mM (d) with 1.5 and 3.0 M NaCl as well as with 10, 50 and 100 μmol photons m−2 s−1 respectively. Values correspond to the mean ± standard deviation of three replicates.

