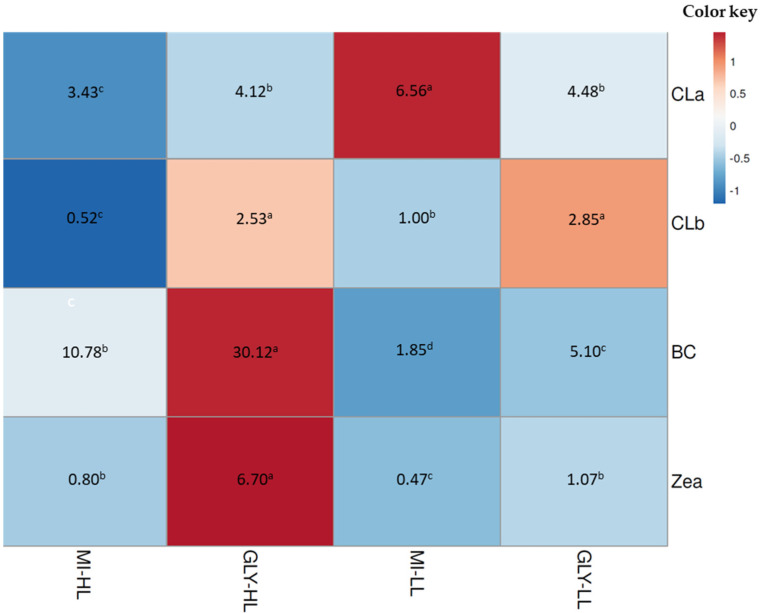
Figure 4.
Heat map colors correspond to lower (blue) and higher (red) abundance for the main pigments of D. salina cultured under mixotrophic conditions. The real concentrations of pigments (pg cell−1) are in the heat map figure. MI-HL and Gly-HL correspond to the inorganic medium and glycerol exposed to 300 µmol photons m−2 s−1, respectively. MI-LL and Gly-LL correspond to the inorganic medium and glycerol exposed to 50 µmol photons m−2 s−1, respectively. Pigments (CLa: chlorophyll a, CLb: chlorophyll b, BC: β-carotene, Zea: zeaxanthin) were separated and identified by HPLC. Different letters in the same row are significantly different between pigment content for each treatment.

