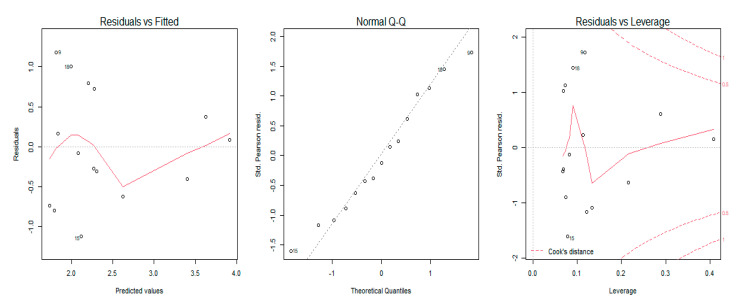
Figure 2.
Graphical residual analysis for the MRC model and sEMG for the biceps brachii muscle. The plot on the left shows the residual errors versus their estimated values and the points on the graph should be arranged randomly. The QQ plot in the center shows the distributive normality of the residuals and the points on the plot should follow the diagonal line. The plot on the right identifies any influential data points on the model. In the plot, the Leverage’s values of the points and the Cook’s distances that measure the influence of each observation on the estimation of the model parameters are present. Cook’s distance values greater than 1 are suspect and indicate the presence of a possible outlier or poor model.

