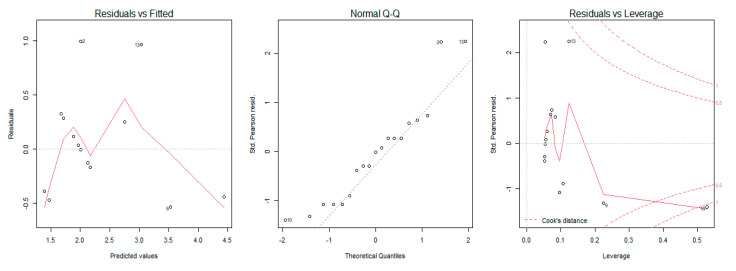
Figure 5.
Graphical analysis of residuals for the MRC and Dynamometry model for Triceps Brachii muscle. The plot on the left shows the residual errors versus their estimated values; the QQ-plot in the center shows the distributive normality of the residuals; the plot on the right identifies any influential data points on the model.

