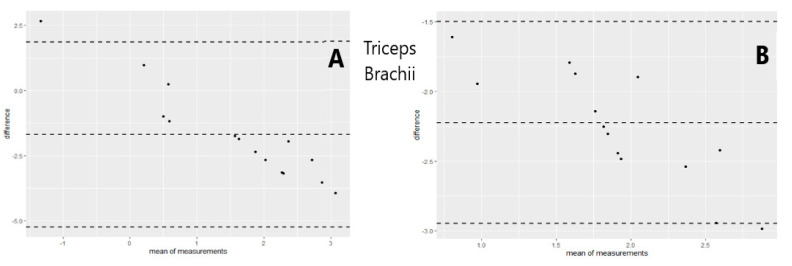
Figure 7.
Differences between MRC scale and sEMG (A) as well as MRC and Dynamometry (B) for Triceps Brachii muscle versus the mean of the two measurements. The central line represents the mean difference (bias A = −1.60; B = −2.22), while the top and bottom lines represent the relative 95% CI (A = −5.23; 1.85) (B = −2.95; −1.49). The Bland–Altman plots highlight the differences of measurements performed with the two instruments. When the points (representing the observations) are scattered within the CI, the instruments can be used interchangeably. This mean that there are no significant differences between the measurements obtained from both instruments.

