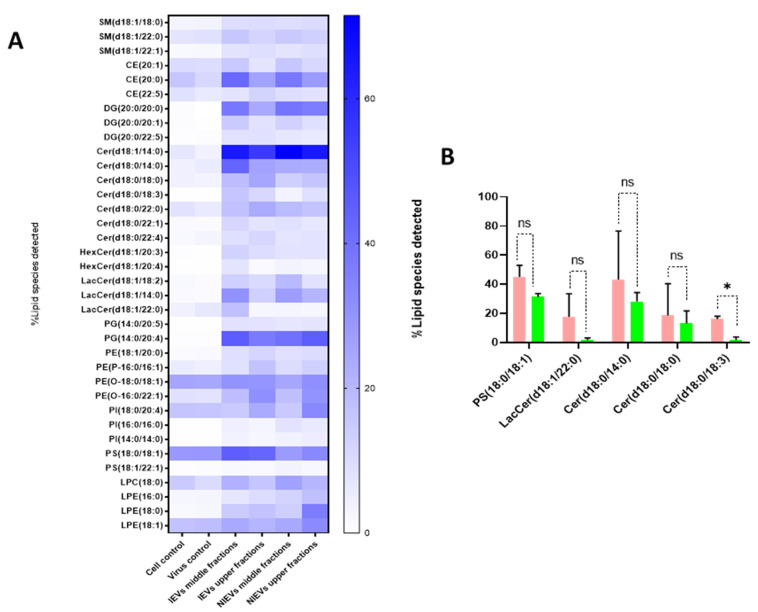
Figure 5.
Distinct differences in the lipidomic profile between cell lysates and EV preparations, as well as NIEVs and IEVs. (A) Lipidomic heat map showing an increase (in percentage) of molecular lipid species per class into EV preparations, as compared to cell lysates. Each horizontal row represents a molecular lipid and each vertical column represents a sample. Lipid abundance ratios are colored according to their percentage. Colored boxes are used to compare the abundance of lipid species within each different class. (B) Five distinct lipid species have shown to be upregulated in infected condition (%mol), but only the levels of Cer(d18:0/18:3) are significantly changed in IEVs (pink), as compared to NIEVs (green) (p < 0.05). SM: sphingomyelin, CE: cholesteryl ester, DG: diacylglycerol, Cer: ceramide, LacCer: lactosylceramide, HexCer: hexosylceramide, PG: phosphatidylglycerol, PE: phosphatidylethanolamine, PI: phosphatidylinositol, PS: glycerophosphoserine, LPC: lysophosphatidylcholine, LPE: lysophosphatidylethanolamine. Data shown are from 3 independent experiments (mean ± SD values). Significance is calculated based on p-values. ns: p > 0.05, * p < 0.05.

