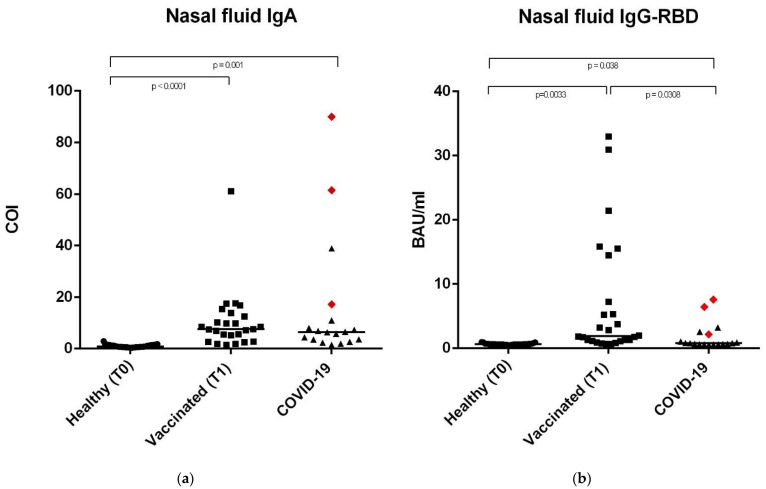
Figure 3.
Anti SARS-CoV-2 IgA-S1 and anti SARS-CoV-2 IgG-RBD in nasal fluid samples. (a) Nasal fluid sample median levels of anti SARS-CoV-2 IgA-S1 in the three study groups, expressed as COI (Cut off index). (b) Nasal fluid sample median levels of anti SARS-CoV-2 IgG-RBD in the three study groups, expressed as Binding Antibody Units (BAU/mL). In the COVID-19 group, the red rhombuses represent the hospitalized subjects. Statistical analysis and construction of figures were performed with GraphPad Prism 8 Software (GraphPad Software, San Diego, CA, USA). The D’Agostino and Pearson test, Shapiro–Wilk normality test, and Kolmogorov– Smirnov test were used to evaluate the non-Gaussian distributions in all of the study populations. The continuous data were displayed as median and range. Non-parametric results were analysed with the Mann–Whitney test. For all of the results, p < 0.05 was considered statistically significant.

