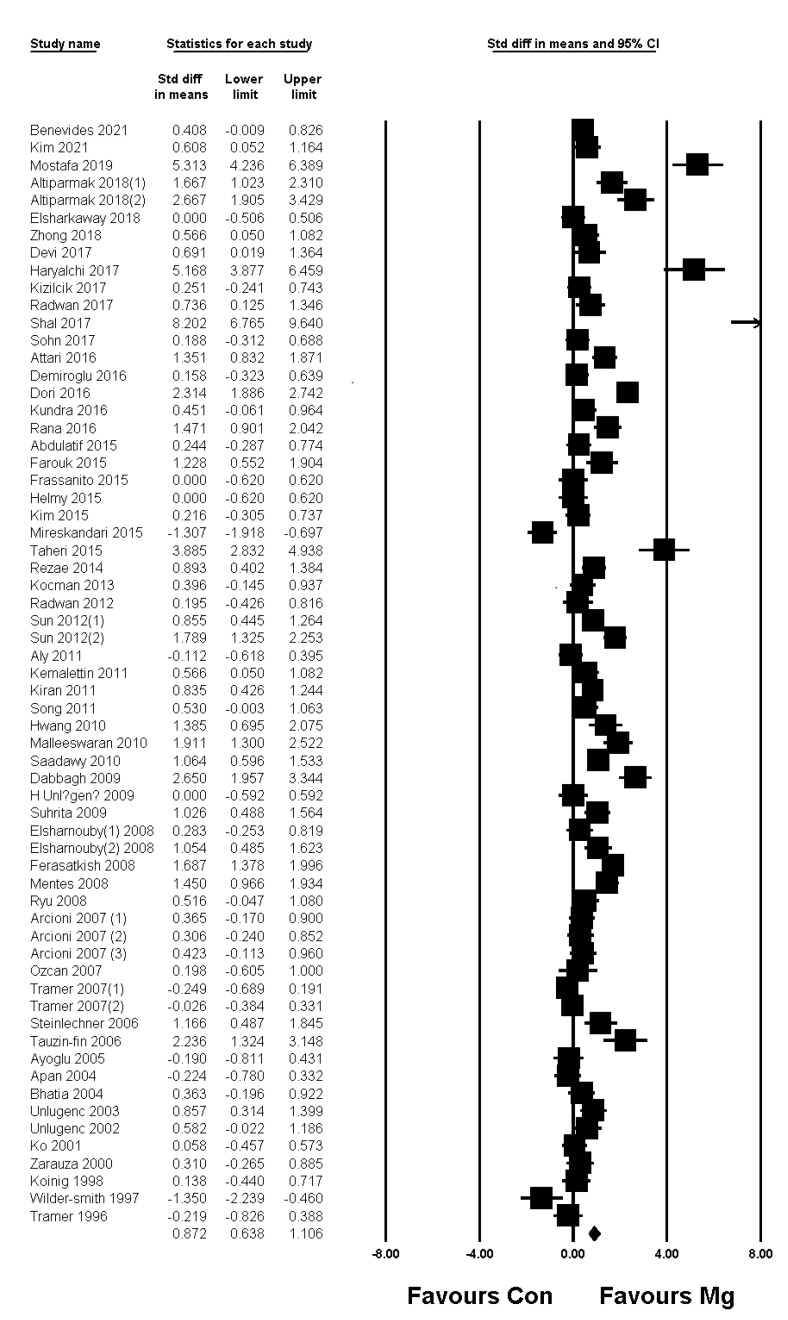
Figure 2.
Forest plot showing pain score at postoperative 4 h in adult patients. The figure depicts individual trials as filled squares with relative sample size and the 95% confidence interval (CI) of the difference as a solid line. The diamond shape indicates the pooled estimate and uncertainty for the combined effect.

