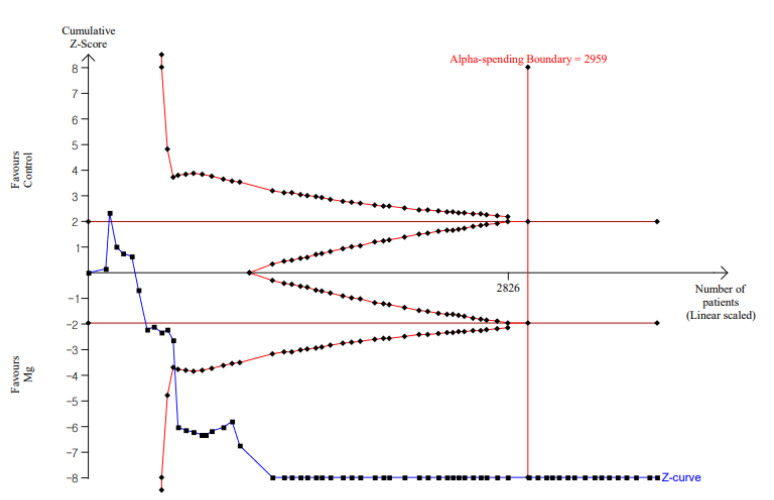
Figure 4.
TSA for resting pain score at postoperative 4 h in adult patients. Complete blue line represents the cumulative Z curve, etched red line represents conventional test boundary, complete outer red line represents the trial sequential monitoring boundary, and complete inner red line represents futility boundary. The cumulative Z curve crossed the conventional test boundary and the trial sequential monitoring boundary.

