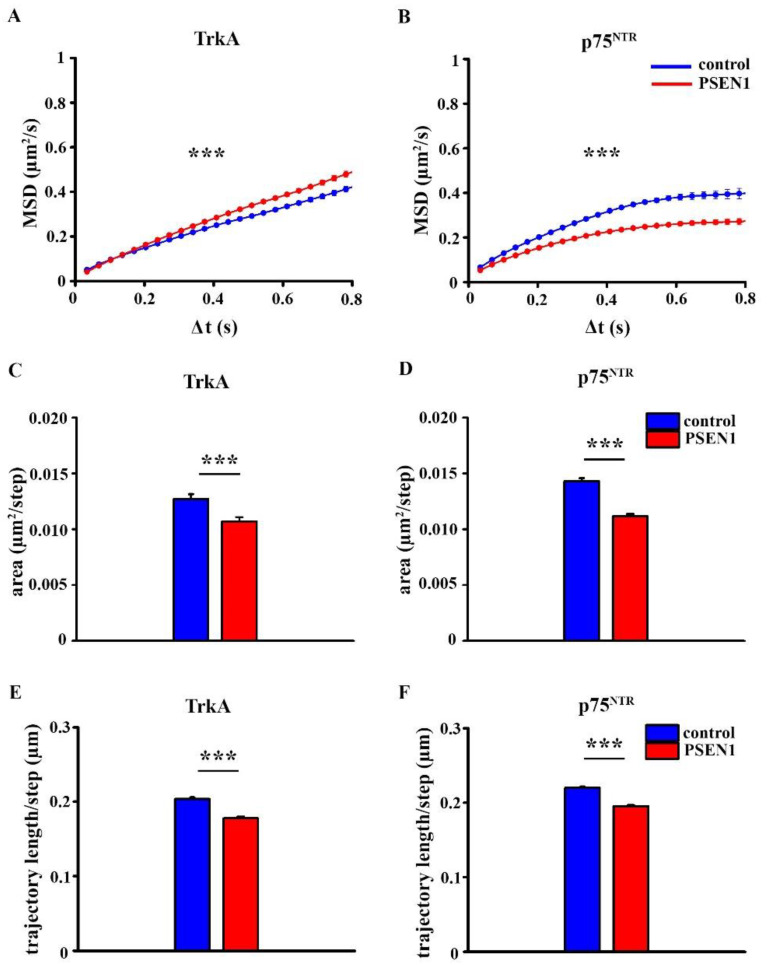
Figure 4.
MSD-Δt plots, diffusion area, and trajectory length of TrkA and p75NTR in the control and PSEN1 mutant neurons. MSD curves show the diffusion modes of TrkA (A) and p75NTR (B) in non-demented and PSEN1 mutant neurites. Graphs display the diffusion area of TrkA (C) and p75NTR (D) in the control and PSEN1 mutant neurites. Histograms exhibit the trajectory length of TrkA (E) and p75NTR (F) in control and PSEN1 mutant neurites. The data are expressed as mean ± SEM (*** p < 0.001). The number of trajectories of TrkA in control and PSEN1 mutant neurons = 1154; 1246, the number of trajectories of p75NTR in control and PSEN1 mutant neurons = 1830; 2148. IPSC lines: Ctrl-1, Ctrl-2, Ctrl-3; fAD-1; fAD-2, fAD-3.

