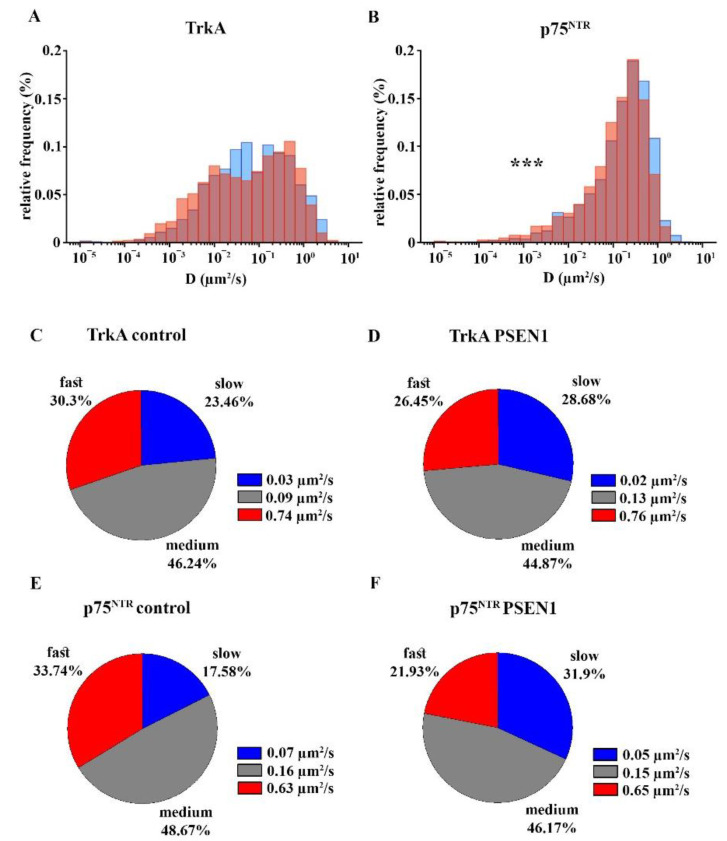
Figure 5.
Distribution of the diffusion coefficients and the percentage of slow, medium, and fast fractions of TrkA and p75NTR in the control and PSEN1 mutant neurons. Logarithmic distribution histograms show the relative frequency of different diffusion intervals in the range of 10−5–10 µm2/s for TrkA (A) and p75NTR (B) in control (blue bars) and PSEN1 mutant neurites (red bars). The number of trajectories of TrkA in control and PSEN1 mutant neurons = 1154; 1246, p75NTR: the number of trajectories of p75NTR in control and PSEN1 mutant neurons = 1830; 2148. Pie charts demonstrate the percentage of slow, medium, and fast fractions of the trajectories of TrkA (C,D) and p75NTR (E,F) per neurite and their average diffusion coefficients in the control (C,E) and PSEN1 mutant neurons (D,F). The data are expressed as mean ± SEM (*** p < 0.001). The number of neurites in the control and PSEN1 mutant cultures for TrkA = 142; 197, the number of neurites in the control and PSEN1 mutant cultures for p75NTR = 154; 219. IPSC lines: Ctrl-1, Ctrl -2, Ctrl -3; fAD-1; fAD-2, fAD-3.

