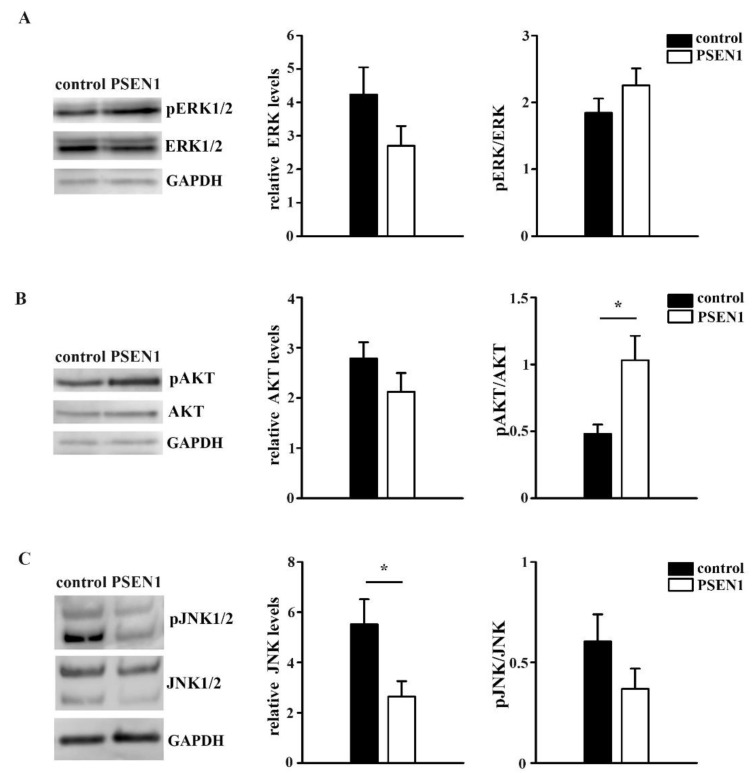
Figure 6.
Signaling pathways in the control and PSEN1 mutant neurons. Representative blots illustrate the expression levels of pERK1/2, ERK1/2, pAKT, AKT, pJNK1/2, and JNK1/2 signaling molecules and GAPDH in PSEN1 mutant and control cultures. Histograms show the expression of ERK (A), AKT (B), JNK (C) normalized to GAPDH and their ratio of pERK/ERK, pAKT/AKT, and pJNK/JNK in the PSEN1 mutant cultures compared to controls. The data are expressed in optical densities (pixel/area) ± SEM (* p < 0.05), IPSC lines: Ctrl-2, fAD-1; n = 6.

