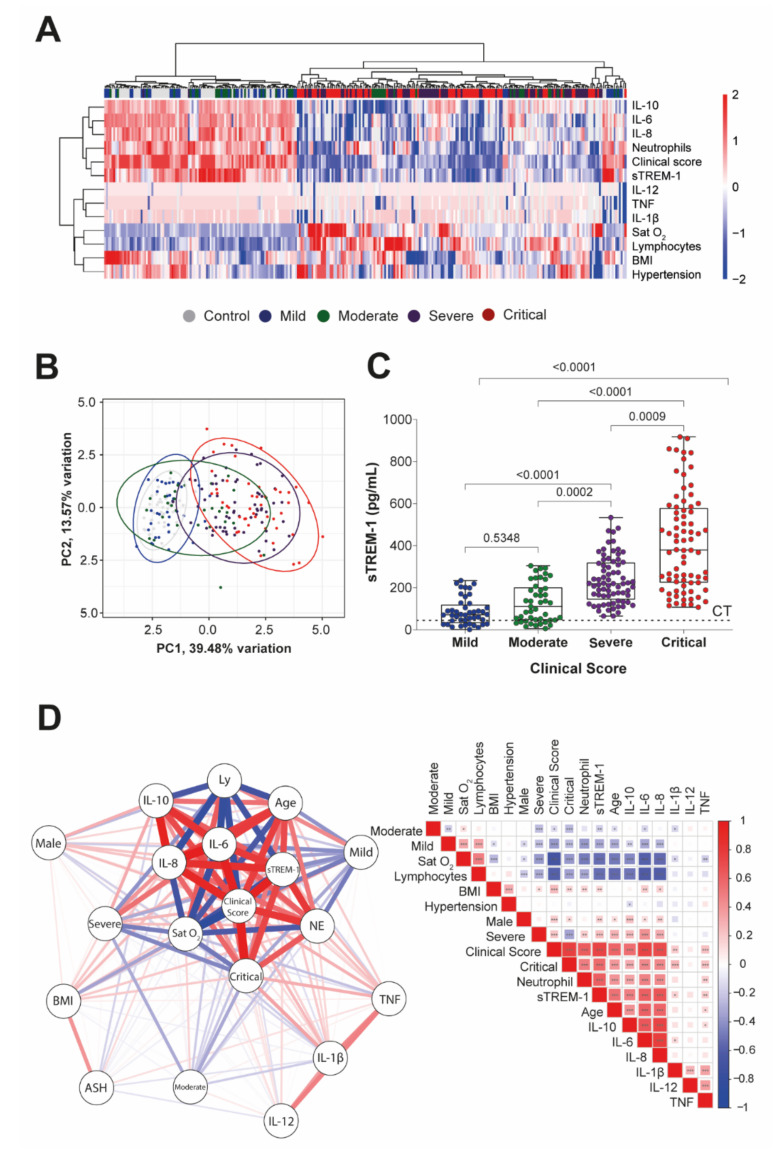
Figure 2.
sTREM-1 levels were correlated with inflammatory cytokine production, comorbidities, and clinical severity of COVID-19 patients. (A) Unsupervised hierarchical cluster heat map showing the expression of markers and clinical parameters (Sat O2, lymphocytes (Ly), neutrophil (NE) counts, BMI, hypertension (ASH), sTREM-1, IL-1β, IL-6, IL-8, IL-10, IL-12, and TNF levels) for different groups of patients, according to the disease score (control, mild, moderate, severe, and critical) data are colored by row normalized value for each sample. (B) The PCA graphic shows the clusterization of those subgroups of patients (95% confidence interval), including all markers exhibited in the heat map, except for the levels of sTREM-1, performed with the base R functions. The continuous variables were transformed to log2 scale, and in the case of the heat map and PCA, the data used were transformed to z-scores (centered and scaled). (C) Levels of sTREM-1 in patients with different severity forms of COVID-19: mild (n = 44), moderate (n = 45), severe (n = 72), and critical (n = 76), as well as control (CT line, n = 50). Median values are presented with ranges. The Kruskal–Wallis test was used for multiple comparisons in data with non-normal distribution. The differences between each group are indicated by the p-value in the graphic above the diagram. (D) The color scale sidebar indicates the correlation coefficients (r), where red represents positive correlation, and blue represents negative correlation. The square size and color intensity are proportional to the correlation coefficients, p values were represented by * <0.05, ** <0.01, and *** <0.001. A network-based on Spearman’s correlation (p < 0.05) was constructed, analyzed, and graphically represented using the R packages.

