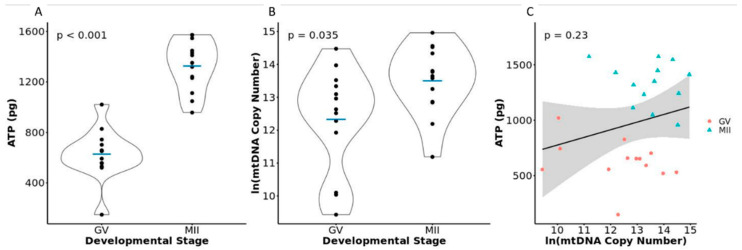
Figure 2.
(A) Violin plot depicting the differences in ATP quantity within single GV stage and MII stage oocytes. (B) Violin plot depicting the natural log of the differences in mtDNA copy number between single GV stage and MII stage oocytes. (C) Scatterplot depicting the relationship between the ATP quantity and natural log of the mtDNA copy number within individual oocytes.

