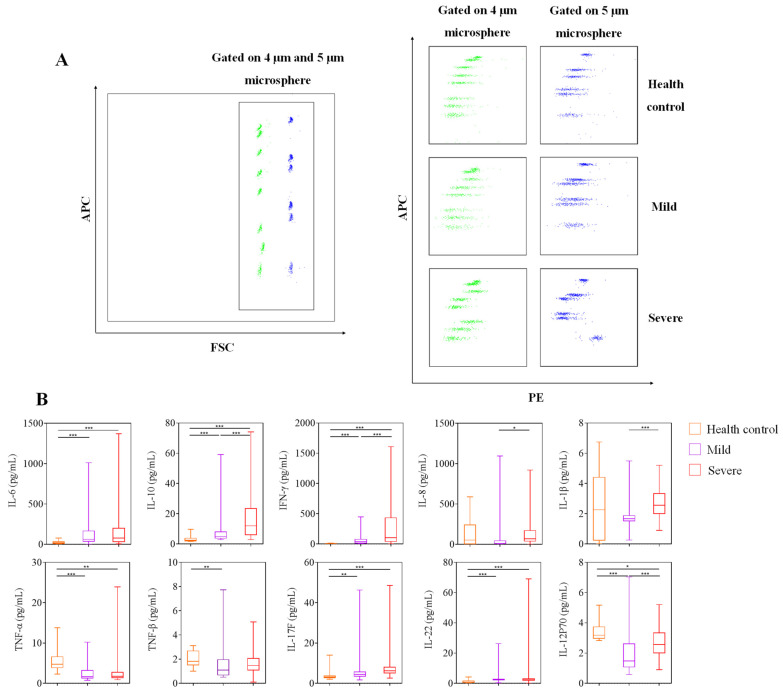
Figure 2.
Serum cytokine analysis. (A) FACS dot plots showed that cytokine was classified by APC fluorescence, and cytokine levels were detected by PE fluorescence intensity. (B) The serum levels of IFN-γ, IL-1β, IL-6, IL-8, IL-10, IL-12p70, IL-17F, IL-22, TNF-α, and TNF-β in the healthy control (n = 20), mild (n = 82), and severe (n = 58) groups shown in graphs (median, IQR). p < 0.05 (*), p < 0.01 (**) or p < 0.001 (***) mean the difference was statistically significant.

