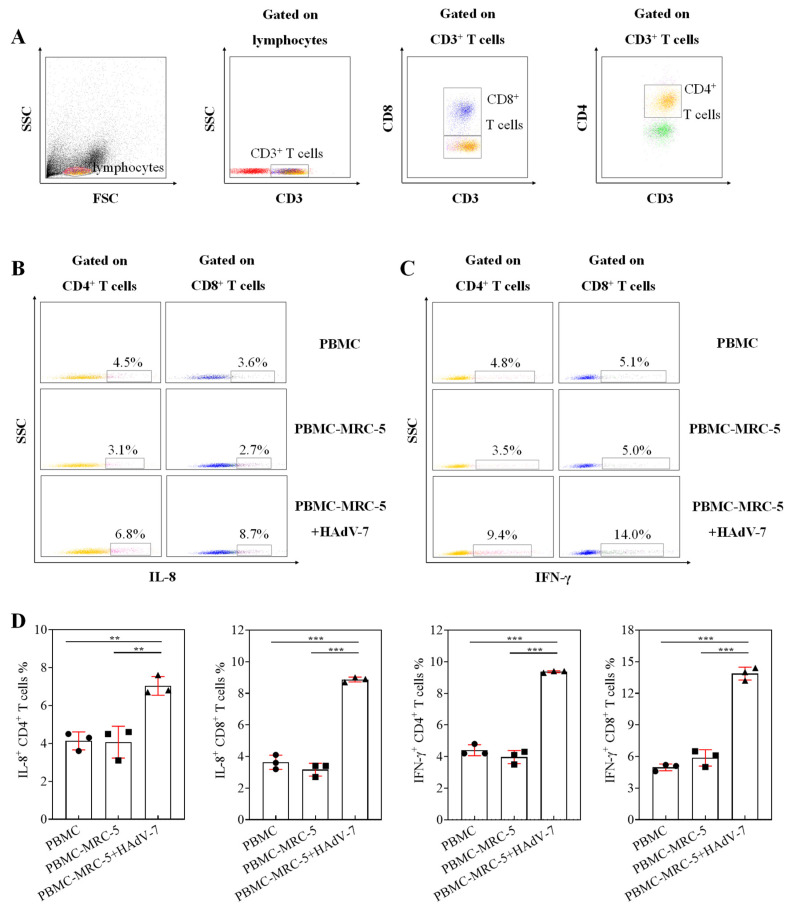
Figure 8.
Detection of T cell function stimulated by adenovirus. (A) FACS dot plots showed the classification of T cells. (B) The FACS dot plots showed the percentage of CD4+ T cells and CD8+ T cells that produced IL-8 in group PBMC, group PBMC-MRC-5, and group PBMC-MRC-5 + HAdV-7. (C) The FACS dot plots shows the percentage of CD4+ T cells and CD8+ T cells that produced IFN-γ in group PBMC, group PBMC-MRC-5, and group PBMC-MRC-5 + HAdV-7. (D) Proportions of T cells producing IL-8 and IFN-γ in each group are shown in graphs. Data expressed as mean ± SD (n = 3), p < 0.01 (**), or p < 0.001 (***) means the difference was statistically significant.

