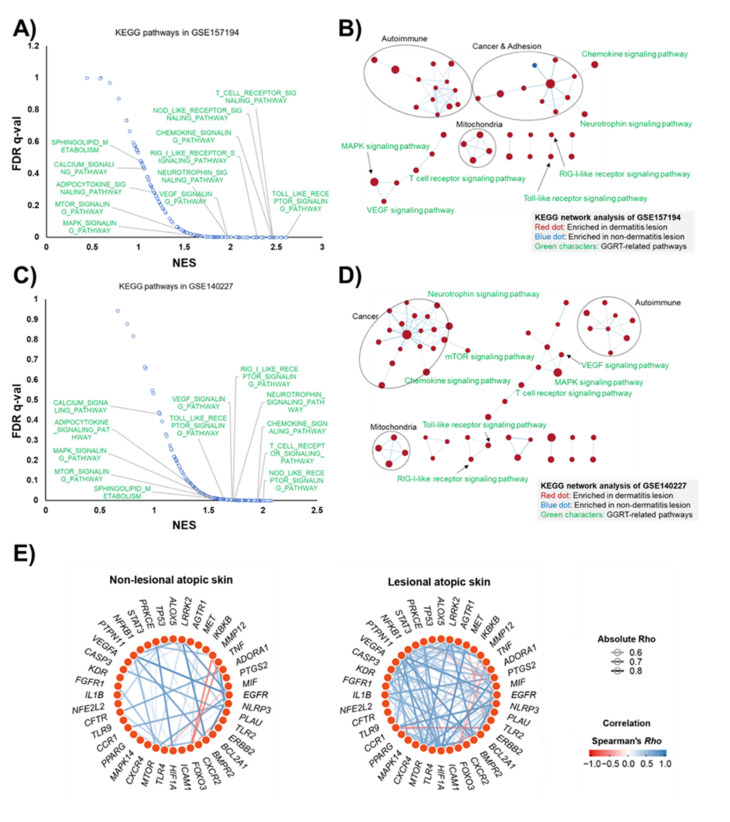
Figure 2.
In silico prediction for GGRT treatment of atopic dermatitis. (A,C) The enhanced pathways of GSEA KEGG enrichment analysis for potential targets of GGRT in two individual gene sets (GSE157194 and GSE140227). (B,D) The potential targets of GGRT were overlapped on the KEGG network analysis of two individual gene sets (GSE157194 and GSE140227). Red dot represent enriched pathways in atopic dermatitis lesions and the blue dots represent enriched pathways in non-disease lesions. Green characters mean the pathways are related to GGRT. (E) Gene networks in non-lesional and lesional skins from atopic dermatitis patients were generated based on correlations (Spearman’s Rho > |0.6| and p < 0.05) among genes, known to mediate the mechanism of action of GGRT. Each edge represents Spearman’s Rho of two connected genes. The red or blue gradient color of each edge indicates a positive or negative correlation, respectively.

