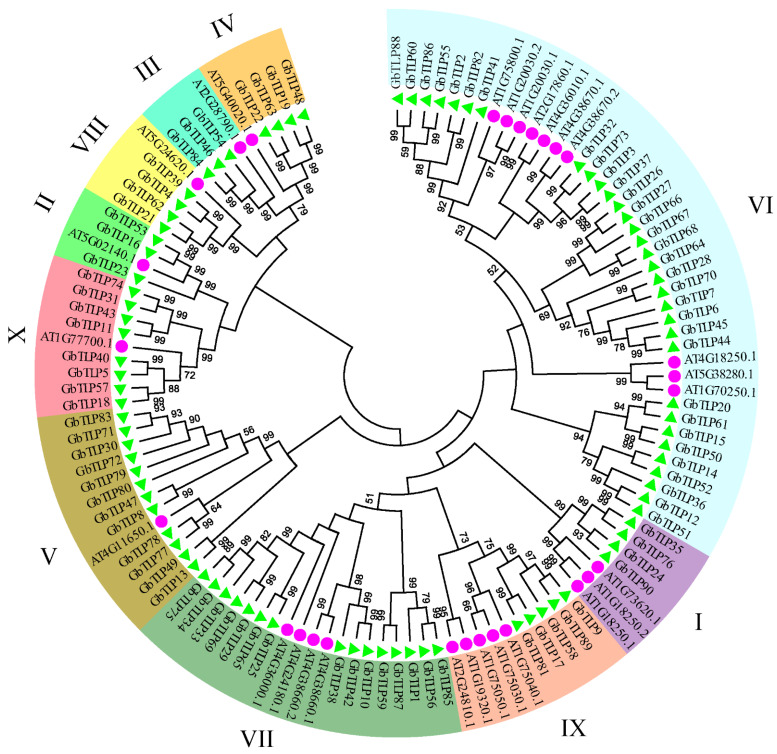
Figure 3.
Phylogenetic analysis of TLPs. AT represents A. thaliana (purple circle); Gb represents G. barbadense (green triangle). The phylogenetic tree was generated using the amino-acid sequences of selected TLPs via NJ methods. All sea island cotton TLPs, together with their A. thaliana counterparts, were classified into 10 groups.

