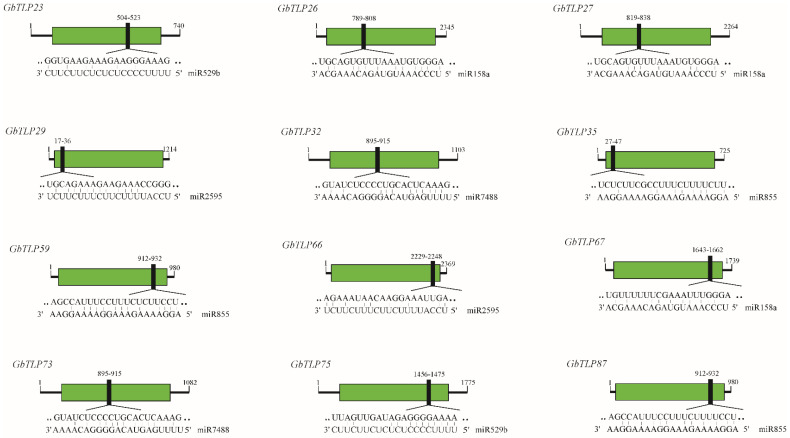
Figure 6.
The prediction of targeting regulatory relations between GbTLP and miRNAs. Black lines represented ORFs of GbTLPs. The thaumatin domains are represented by boxes filled with green. miRNA complementary sites (black filling) with the nucleotide positions of GbTLP cDNAs are highlighted. The RNA sequence of each complementary site from 5′ to 3′ and the predicted miRNA sequence from 3′ to 5′ are shown in the expanded regions.

