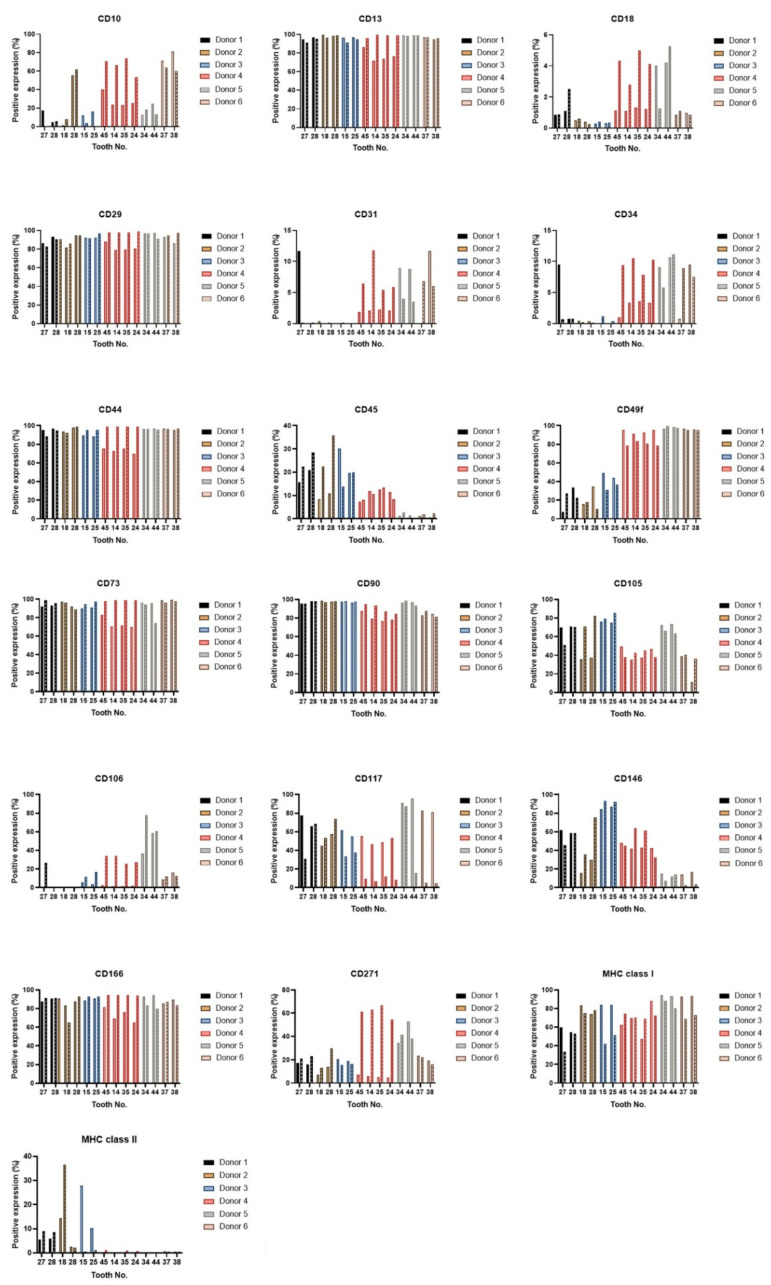
Figure 5.
Immunophenotype profile of all paired lineages in the 3rd and 7th passages. Data for the 7th passage are depicted as boxes filled with patterns. The layouts of graphs illustrate percentages of positive cells, determined as the percentage with a fluorescence intensity greater than 99.5% of the negative isotype immunoglobulin control. After normality had been ascertained using a Shapiro–Wilk test or Kolmogorov–Smirnov test, paired lineages were compared using paired t-test for continuous variables, or Wilcoxon matched-pairs test on ranks for nonparametric variables. No variances were shown as statistically significant.

