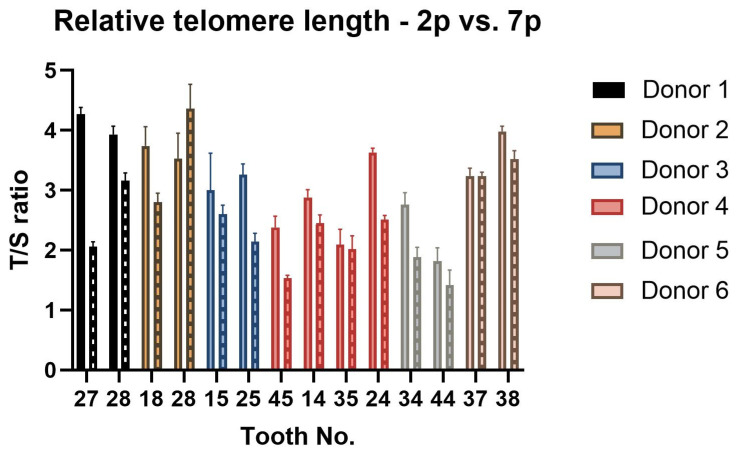
Figure 6.
The relative telomere length change measurement between 2nd and 7th passage—T/S ratio. Data are presented as a mean, and SD plotted as error bars. Data for the 7th passage are depicted as boxes filled with patterns. The error bars were calculated for three technical replicates without biological replicates. The statistical significance was calculated using a paired t-test; no comparison was statistically significant. The trend of relative telomere length shortening in the 7th passage measurement was statistically significant compared to the measurement performed in the 2nd passage (p < 0.05).

