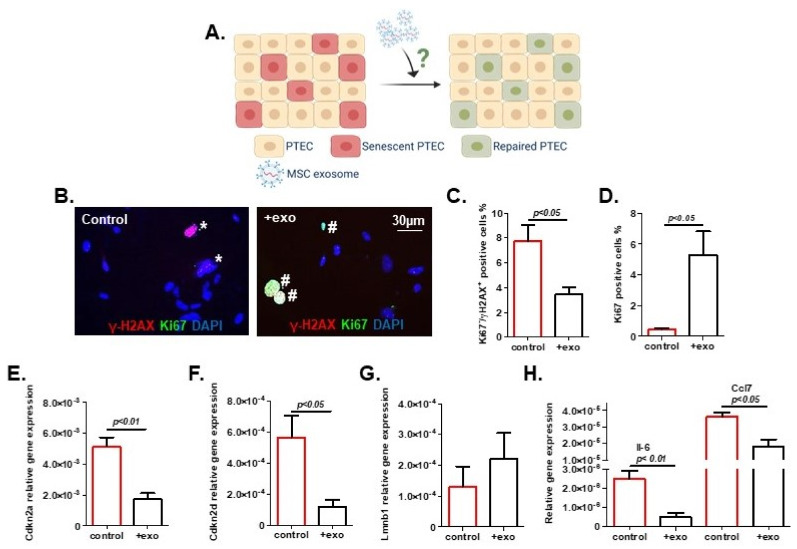
Figure 5.
Exosome treatment reduced primary tubular epithelial cell (PTEC) senescence. (A) Schematic of experimental procedure (created using BioRender). (B) Representative images of PTEC showing immunofluorescent staining for γ-H2AX and Ki67. Cells were counted as senescent (marked with *) when Ki67 negative and simultaneously positive for over five γ-H2AX foci. Ki67-positive cells are marked with #. Percentages of (C) senescent cells and (D) proliferating cells were quantified. Transcription level of senescent markers: (E) Cdkn2a, (F) Cdkn2d, (G) Lmnb1, and (H) senescence-associated secretory phenotype (SASP) markers Il-6 and Ccl7. Exosomes: exo. Results are presented as means ± SEM (n = 4). Significances were calculated by t-test. The population bars expressing higher senescence are marked in red.

