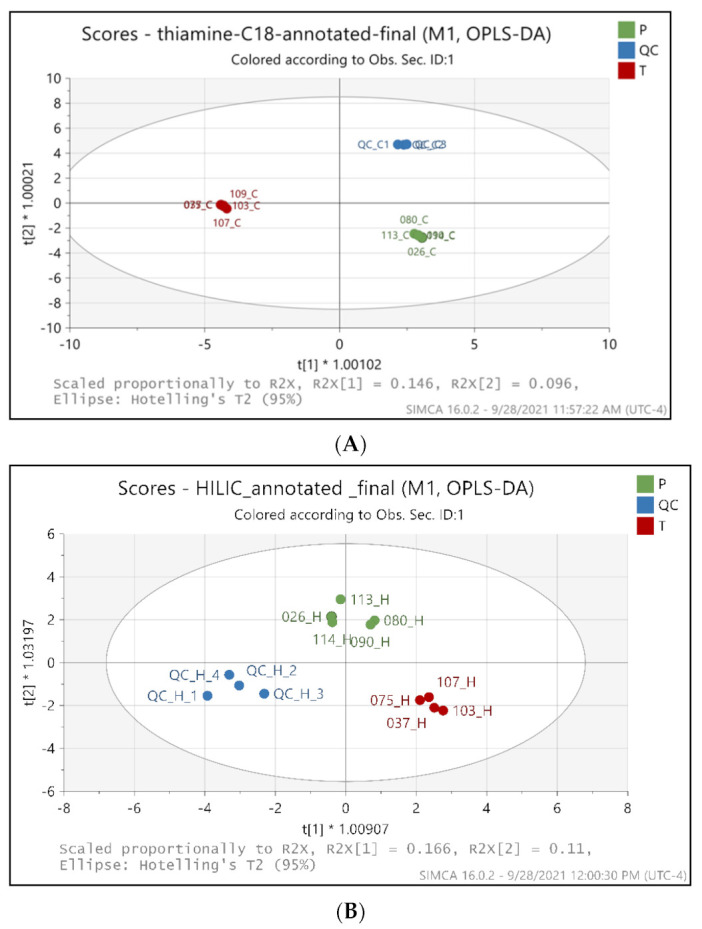
Figure 2.

OPLS-DA score plots between the metabolites identified in placebo and benfotiamine treated serum samples in C18 mode (A) and HILIC mode (B). Green dots-Placebo samples, Red dots-benfotiamine-treated samples, Blue dots-QC pooled samples. Each dot represents a sample. P-Placebo, T-benfotiamine treated.
