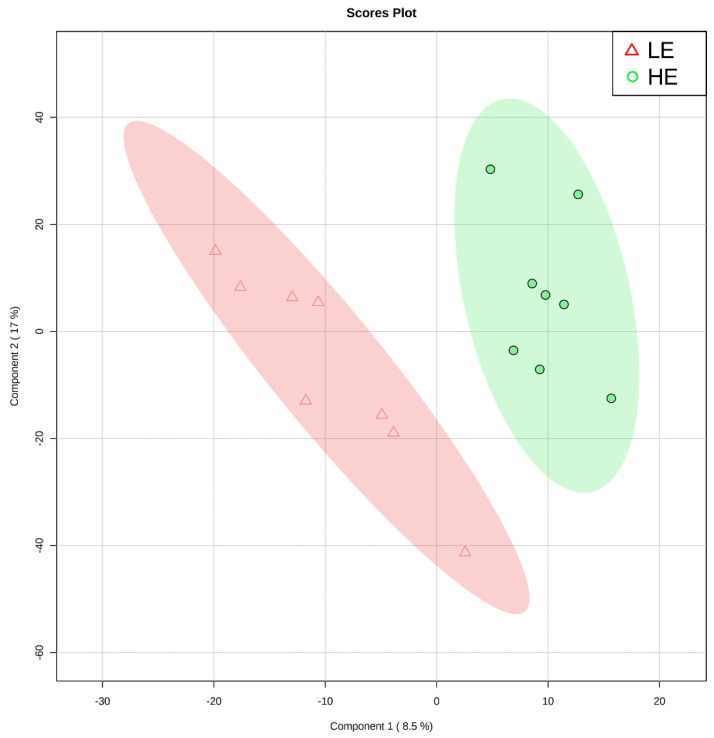
Figure 1.
Partial least squares-discriminant analysis score plot of the first two principal components for untargeted blood plasma metabolomic analysis of low feed efficient (LE; red triangles; n = 8) and high feed efficient (HE; green circles; n = 8) mid-lactation multiparous dairy cows enrolled in a 45-day feed efficiency study.

