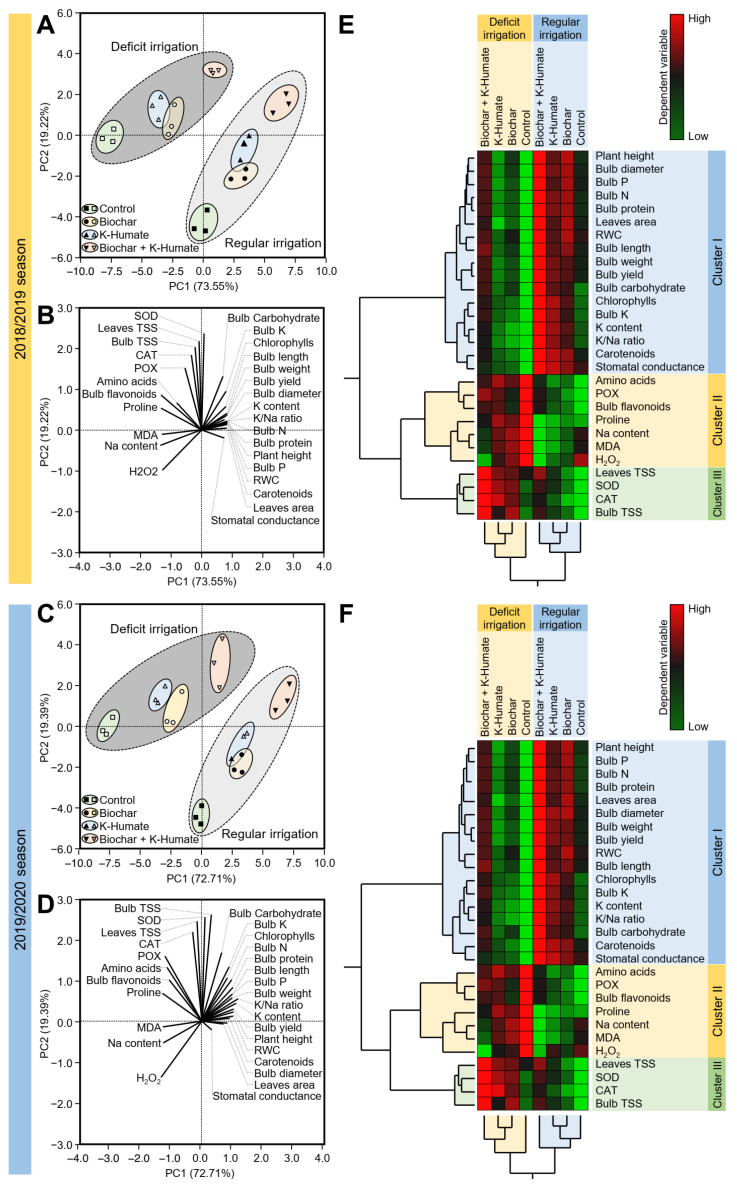
Figure 10.
Principal component analysis (PCA) and two-way hierarchical cluster analysis (HCA) of individual response variables assessed in onion plants grown in sodic-saline soil and irrigated regularly (Every 30 days) or stressed with deficit irrigation (every 45 days) after soil amendment using biochar and/or K-humate foliar application during 2018/2019 and 2019/2020 seasons. (A,C) PCA-associated scatter plots during 2018/2019 and 2019/2020 seasons, respectively, (B,D) PCA-associated loading plots during 2018/2019 and 2019/2020 seasons, respectively, (E,F) Two-way HCA during 2018/2019 and 2019/2020 seasons, respectively. Variations in the dependent variables among studied treatments are visualized as a heat map. Rows correspond to dependent variables, whereas columns correspond to different treatments. Low numerical values are green colored, while high numerical values are colored red (see the scale at the top right corner of the heat map).

