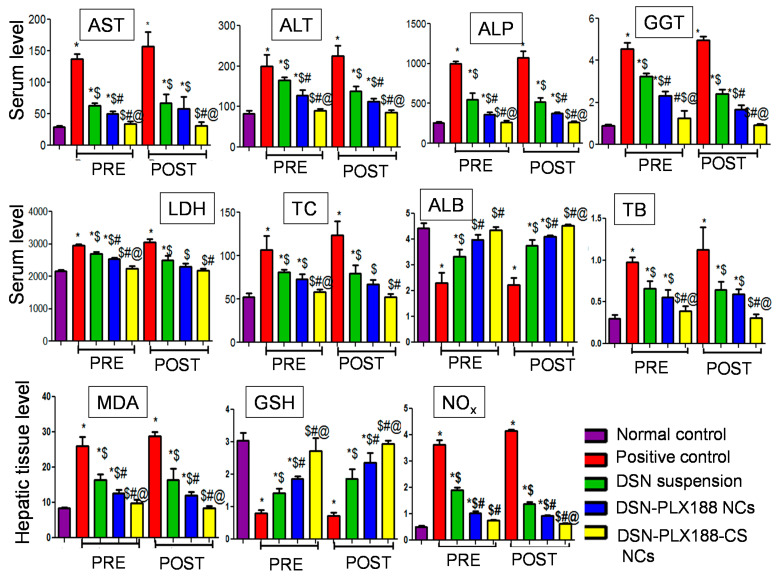
Figure 6.
The serum/hepatic tissue levels of the examined biomarkers following the pretreatment (PRE) and the post-treatment (POST) regimens. Data are expressed as the mean ± SD (n = 6). The statistical analysis was performed at p < 0.05. *, $, # and @ indicate significant differences. * vs. the normal control. $ vs. the positive control. # vs. DSN-suspension-treated group. @ vs. DSN–PLX188-NC-treated group. AST, aspartate aminotransferase; ALT, alanine aminotransferase; ALP, alkaline phosphatase; GGT, gamma glutamyl transferase; LDH, lactate dehydrogenase; TC, total cholesterol; ALB, albumin; TB, total bilirubin; MDA, malondialdehyde; GSH, reduced glutathione; NOx, nitrate/nitrite production.

