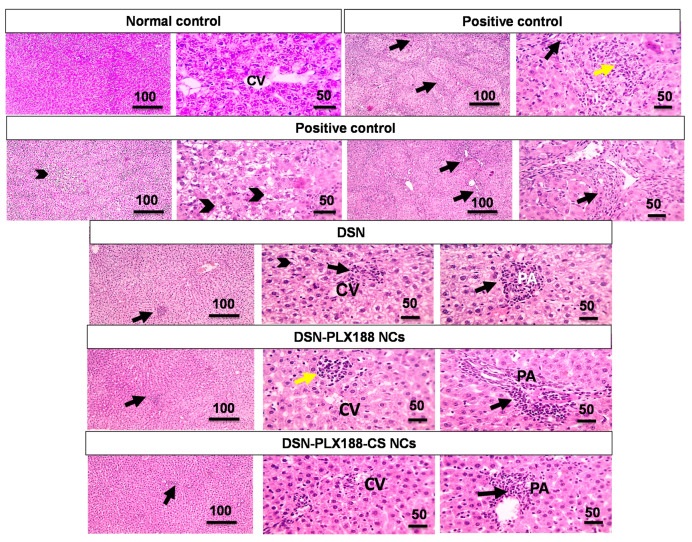
Figure 8.
Microscopic pictures of hematoxylin and eosin (H&E)-stained hepatic sections of the different groups following the post-treatment regimen. Low magnification x: 100 bar 100 µm and high magnification x: 400 bar 50 µm. CV, central vein; PA, portal area. In the positive control: portal fibrosis and inflammation (black arrows); lobular inflammation (yellow arrow); hydropic degeneration in hepatocytes (arrowheads). In the DSN-post-treated group: lobular inflammation close to the central vein (black arrow); portal inflammation (black arrow); hydropic degeneration in the hepatocytes (arrowheads). In the DSN–PLX188-NC-post-treated group: lobular inflammation (yellow arrow); portal inflammation (black arrow). In the DSN–PLX188–CS-post-treated group: leukocytic cell infiltration in portal area (black arrow).

