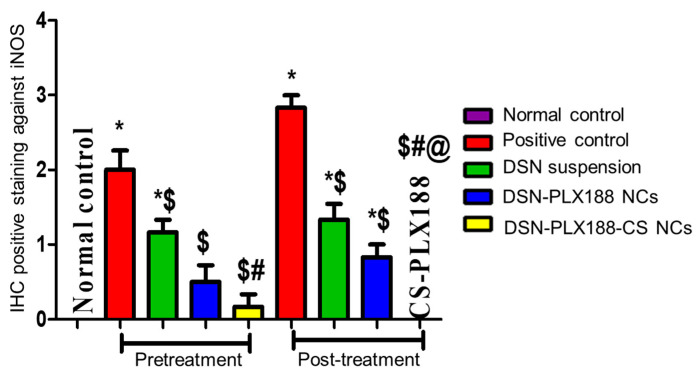
Figure 11.
Statistical analysis of immunohistochemical (IHC) staining intensity of iNOS in the hepatic tissue of the different groups following the pretreatment and the post-treatment regimens. Data are presented as the mean ± SD. The statistical analysis was performed at p < 0.05. *, $, # and @ indicate significant differences. * vs. the normal control. $ vs. the positive control. # vs. DSN-treated group. @ vs. DSN–PLX188-NC-treated group.

