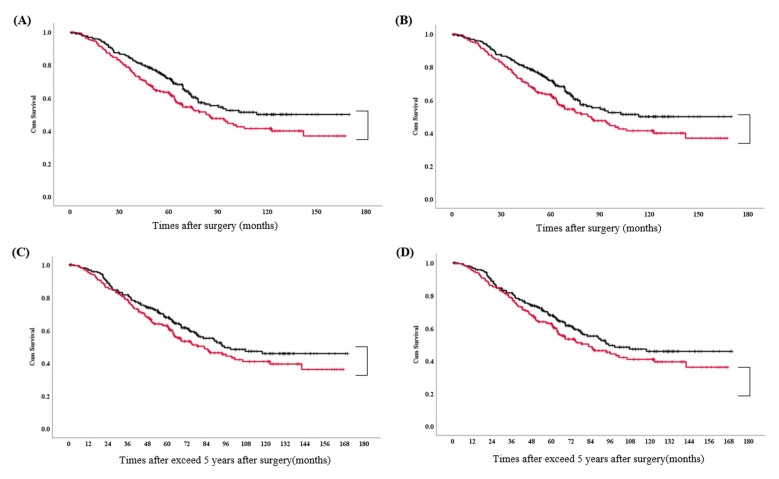
Figure 4.
Kaplan–Meier curves. Overall survival curve (A) and disease-free survival curve (B) stratified by the degree of mediastinal lymph node dissection. Overall survival curves after 5 years of follow-up, before (C) and after (D) propensity adjustment. Black line: lobe-specific lymph node dissection; red line: systemic lymph node dissection.

