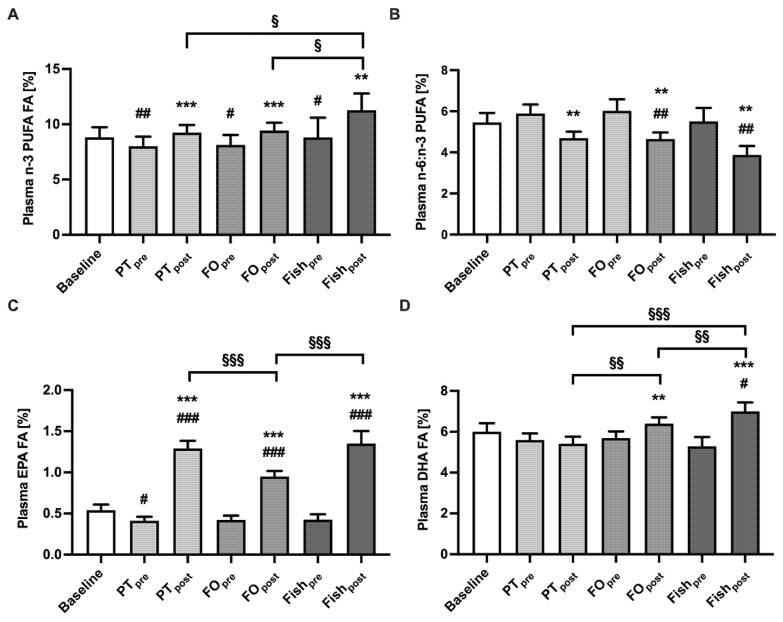
Figure 2.
Change of plasma fatty acids concentrations upon intervention. n-3 PUFA (panel (A)), n-6 PUFA to n-3 PUFA ratio (B), EPA (C), and DHA (D) in plasma were determined before (“pre”) and after two weeks (“post”) intervention. Values are expressed in percent as mean ± SEM from 22 (PT, FO), or nine (Fish) participants. Statistics: * indicate differences to “pre”, # indicate differences to baseline, § indicate differences between different interventions. **/##/§§ p < 0.01, ***/###/§§§ p < 0.001. Abbreviations: PT, Interventions with Phaeodactylum tricornutum; FO, Intervention with fish oil; Fish, Intervention with salmon; n-3 PUFA, polyunsaturated omega-3 fatty acids; EPA, Eicosapentaenoic acid; DHA, Docosahexaenoic acid.

