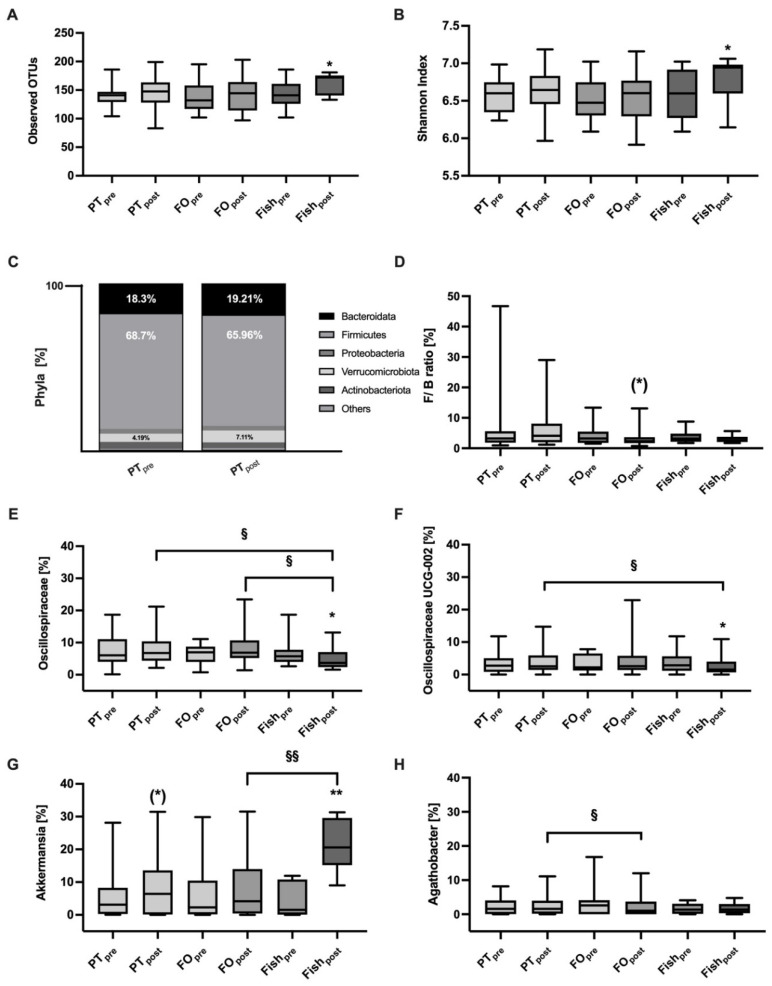
Figure 5.
PT did not affect the gut microbiome. The α-diversity (Observed OTU, panel (A)) and the Shannon index (panel (B)) increase following the fish intervention. Relative bacterial abundancies at the phylum level (panel (C)) and the Firmicutes/Bacteroides (F/B) ratio (panel (D)) remained unchanged. Some changes of selected bacterial in family and genus level were found only after fish consumption (panel (E–H), see Supplementary Table S3). Data are shown as bar plots (panel (C)) or as box plots with median, 25% and 75% percentiles, min and max. * indicate differences to “pre”, § indicate differences between different interventions. (*) p = 0.1, */§ p < 0.05, **/§§ p < 0.01.

