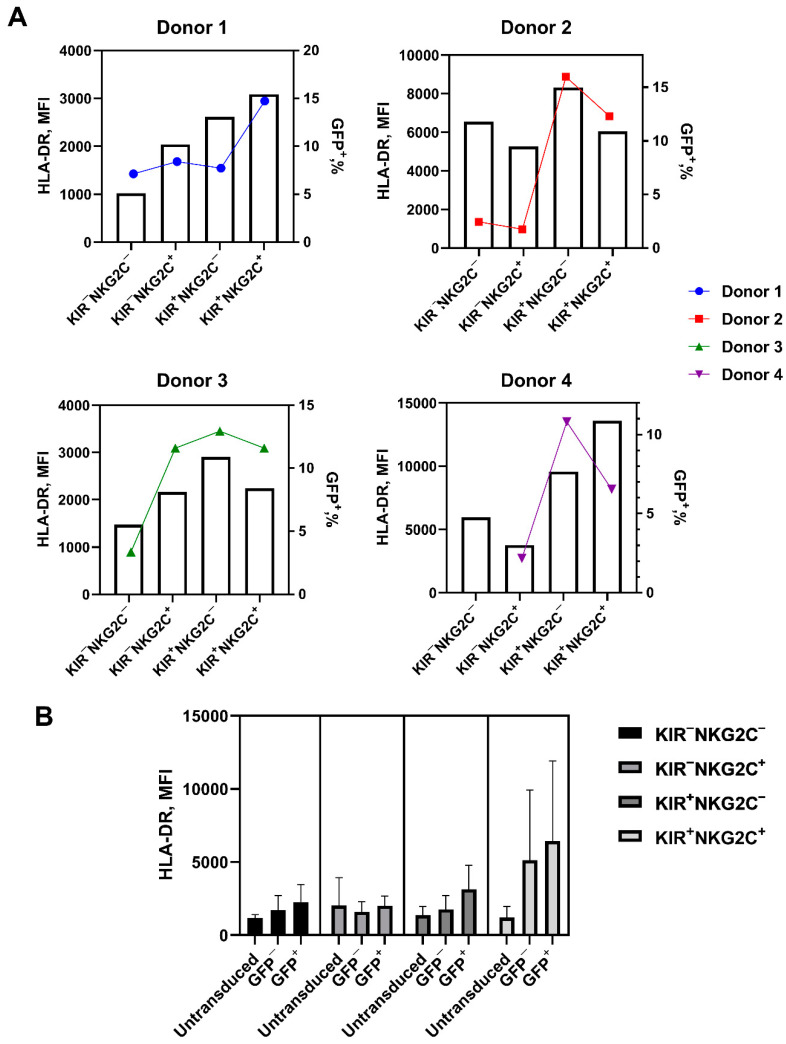
Figure 6.
HLA-DR expression level in the cultures of transduced and untransduced NK cells from the subpopulations that initially did not express CD57 and differed in the expression of NKG2C and KIR2DL2/3. (A) HLA-DR expression level in the cultures of the studied subsets from the four individual donors after 7 days of stimulation with IL-2 and feeder cells. The left Y axis is HLA-DR expression level (bars). The right Y axis is the transduction level (colored dots and lines). (B) HLA-DR surface expression level in the cultures of the transduced and untransduced NK cells from the studied subpopulations on day 7, after the transduction.

