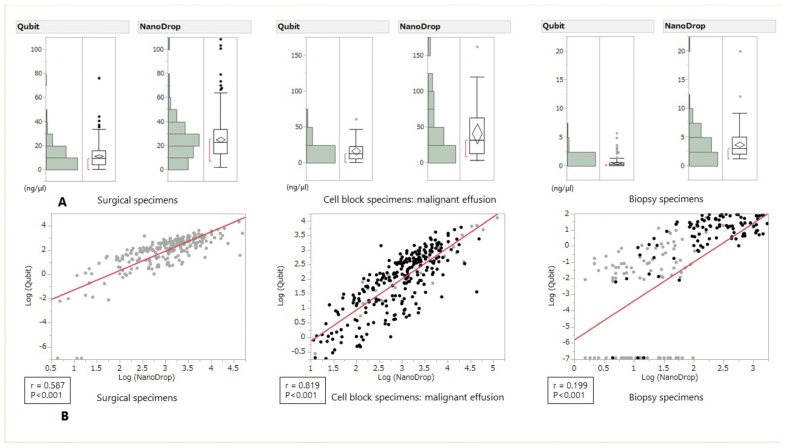
Figure 2.
DNA concentration measured by Qubit and NanoDrop and grouped according to tissue type (A): Surgical specimens, Cell block specimens, Biopsy specimens and Scatter plot for the correlation analysis between Qubit and NanoDrop measurements (B). The R coefficients were 0.587 for the surgical specimens, 0.819 for the cell block specimens, and 0.199 for the biopsy specimens.

