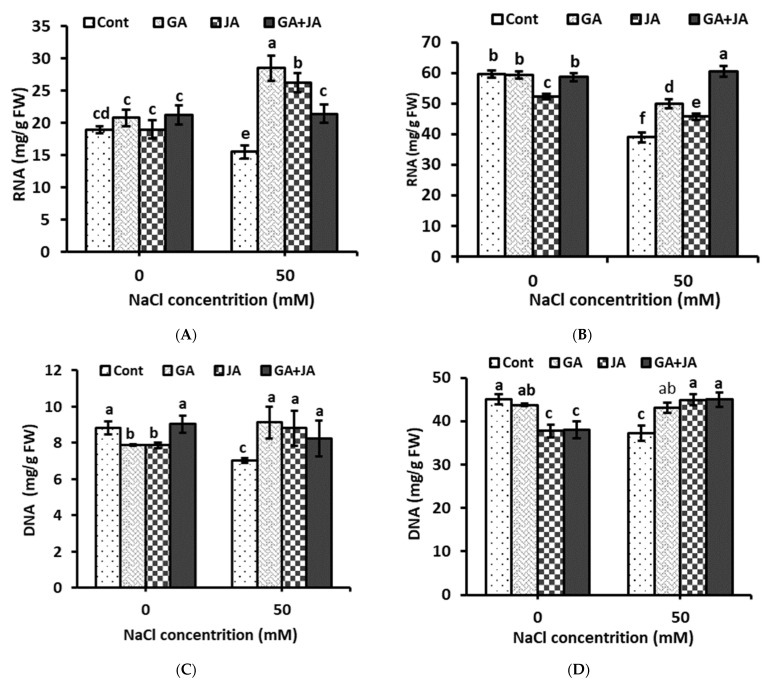
Figure 6.
Concentration of nucleic acids—(A) RNA in shoot; (B) RNA in root; (C) DNA in shoot; and (D) DNA in root—of non-salinized and salinized summer squash plants, as affected by seed priming with 1.5 mM GA, 0.005 mM JA, and mixture of them. Data represent mean of three replicates (n = 3) with error bars indicating standard error of the mean. Bars carrying different lowercase letters are significantly different at p < 0.05 according to Duncan’s multiple range Test. p values for two-way ANOVA are reported in Table 1.

