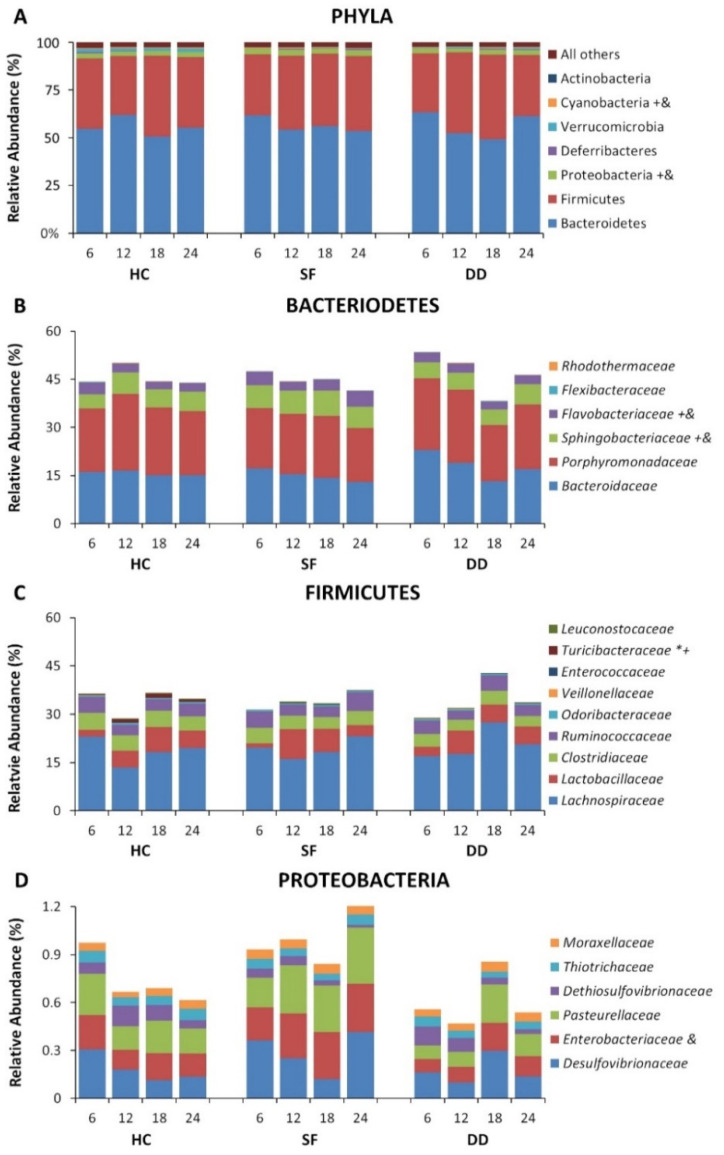
Figure 3.
Relative abundance of selected microbiota after Recovery for the home cage control (HC), dark disturbed (DD) and sleep fragmented (SF) experimental groups plotted at 6 h sampling intervals beginning at light onset. (A) Relative abundance at the phylum level. (B) Relative abundance at the family level for Bacteroidetes. (C) Relative abundance at the family level for Firmicutes. (D) Relative abundance at the family level for Proteobacteria. Significance is indicated beside the classification name: *, p < 0.05, SF compared to control; +, p < 0.05 DD compared to control; &, p < 0.05 DD compared to Light SS. All Pairwise Multiple Comparison Procedures performed using the Holm–Sidak method. Data at the phylum level are shown as a percentage of all identified phyla. Data at the family level are shown as a percentage of the total identified sequences for the families shown.

