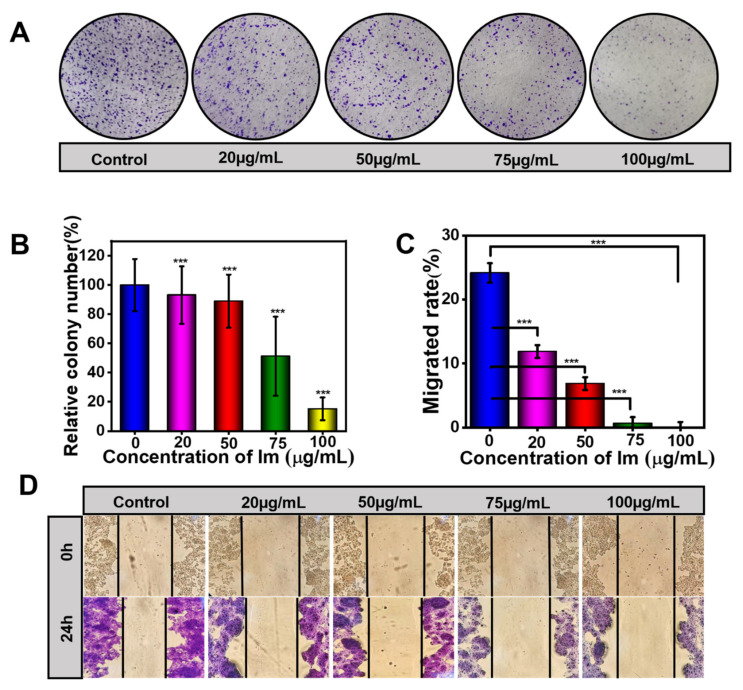
Figure 3.
Im inhibited cell colony formation and migration. (A)Typical representative photographs of HepD cells that were subjected to a colony formation assay. HepD cells were exposed to various concentrations of Im (0, 20, 50, 75 and 100 µg/mL) for 24 h, followed by staining with crystal violet. (B) Quantitative statistics of the number of cells corresponding to A. Negative control: 0 µg/mL. (C) Quantitative statistics of the scratch distance of cells corresponding to D. (D) For the wound healing assay, HepD cells were treated with 0, 20, 50, 75 and 100 µg/mL Im. Typical representative photographs of HepD cells migration after treatment with Im for 0 h and 24 h. Data represent means ± S.D. of three independent experiments. ***: p < 0.001 compared with the control. Negative control: the scratch distance of cells at 0 h.

