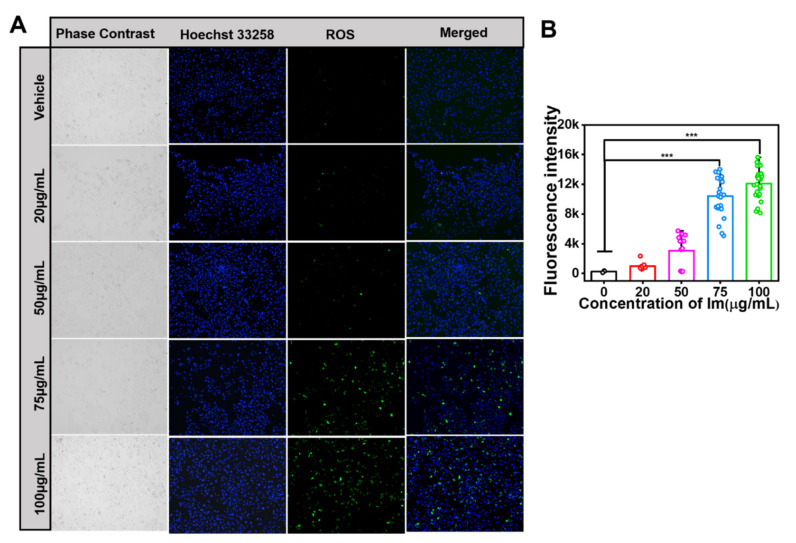
Figure 5.
Im-induced ROS production in HepD cells. (A) The production of intracellular ROS levels was detected with DCFH-DA (ROS-positive cells are in green) and the nucleus was stained with Hoechst 33258 (nucleus are in blue). HepD cells were incubated with 0, 20, 50, 75 and 100 µg/mL Im for 24 h and the intensity of green fluorescence increased significantly as the concentration of Im increased. (B) Quantitative statistics of ROS fluorescence intensity corresponding to A. Data represent means ± S.D. of three independent experiments. ***: p < 0.001 compared with the control.

