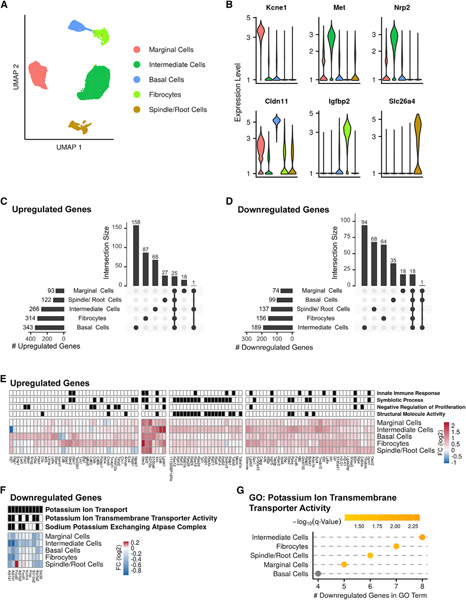
Figure 4. scRNA-seq analysis of the response of the lateral wall to noise.
(A) UMAP of the 25,599 LW cells (n = 4 biological replicates for each condition).
(B) Violin plots for the expression levels of known marker genes, colored according to cell type as in (A).
(C and D) Upset plots of upregulated (C) and downregulated (D) DEGs in noise versus control comparisons.
(E) Heatmap showing the DEGs induced by a fold change greater than 1.5 (FDR q < 0.05; MAST’s statistical test) in at least one cell type. The grid above the heatmap shows selected GO term enriched in each of the clusters (q < 0.05, hypergeometric test).
(F and G) A program of gene repression upon noise exposure shared by most of the LW cell types is enriched for genes that function in potassium transport (hypergeometric test).

