
Figure 2.
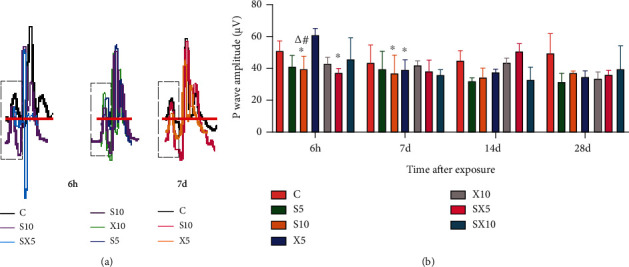
P wave of ECG of rats after S- and X-band microwave exposure. (a) Changes of the P wave (the dotted line boxes show the P wave). (b) Analysis of the P wave amplitude. Data was expressed as means ± SD. Compared with the C group, ∗ meant P < 0.05 and ∗∗ meant P < 0.01; for significant frequency-dependent effect, ▵ meant P < 0.05; for significant dose-dependent effect, # meant P < 0.05 (n = 5).