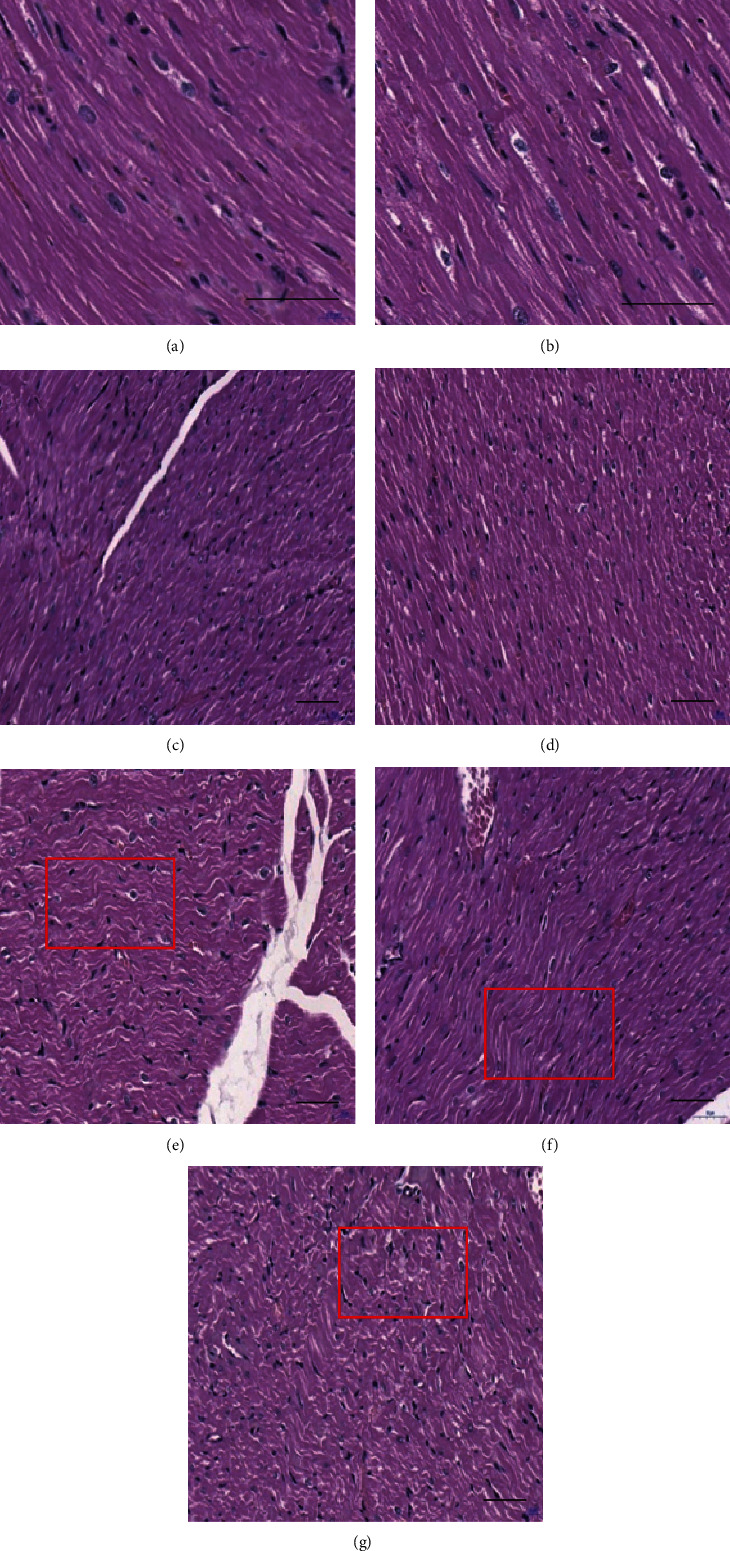
Figure 5.

Changes of myocardial structure of rats on the 7th day after S- and X-band microwave exposure. (a) C group. (b) S5 group. (c) S10 group. (d) X5 group. (e) X10 group. (f) SX5 group. (g) SX10 group. (a, b) ×400. (c–g) ×200. Scale bar = 50 μm. The red frame indicated wavy fibers.
