Figure 8.

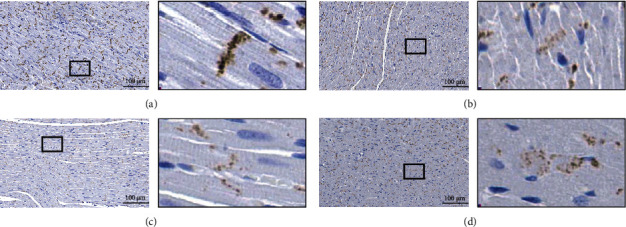
Changes of Cx43 distribution in rats' myocardial tissue on the 7th day after microwave radiation. (a) C group. (b) S10 group. (c) X10 group. (d) SX10 group. (a–d) ×400. Scale bar = 100 μm.

Changes of Cx43 distribution in rats' myocardial tissue on the 7th day after microwave radiation. (a) C group. (b) S10 group. (c) X10 group. (d) SX10 group. (a–d) ×400. Scale bar = 100 μm.